A RAP Power System Blueprint Deep Dive
Balancing act. Two-sided contracts for difference for a speedy, cost-efficient and equitable energy transition
Monika Morawiecka & Dominic Scott
Introduction
The European energy sector is facing a triple challenge: ensuring a speedy and cost-efficient rollout of renewables, protecting consumers from price shocks and safeguarding security of supply. As the 2022 energy crisis showed, political acceptance of high electricity prices is limited, and it is prudent to assume that it will remain this way. At the same time, the sheer scope of regulatory challenges associated with getting to net zero is so vast, that whenever possible, we need to find regulatory solutions that support many objectives at the same time.
Well-designed two-sided contracts for difference (CfD) for renewables are a promising tool to deliver on these multiple objectives. A state-backed risk-sharing tool between investors and consumers, they protect consumers from price shocks, and by lowering the cost of capital, they lower the cost of RES (renewable energy sources) deployment.
Wind and solar currently provide around one-fifth of EU electricity generation. The massive expansion plan put forward by the REPowerEU Plan means that the share of these technologies in total EU electricity generation could reach 50% by 2030 (Figure 1). Limiting the cost of this build-out is therefore important to keep total system costs in check and preserve public support for renewables.
Note: This paper is accompanied by the related Blueprint deep dive ‘The search for an efficient two-sided CfD design efficiency – a Shakespearean history,’ which points policymakers towards innovative CfD designs that minimise the market distortions that plague many of the older and less smart CfD designs.
Table of Contents
Relevant Factsheets:
Figure 1. Installed capacities of wind and solar and share of generation
Installed wind and solar capacities in 2022 and as
projected by Fit-for-55 and REPower EU for 2030 (GW)

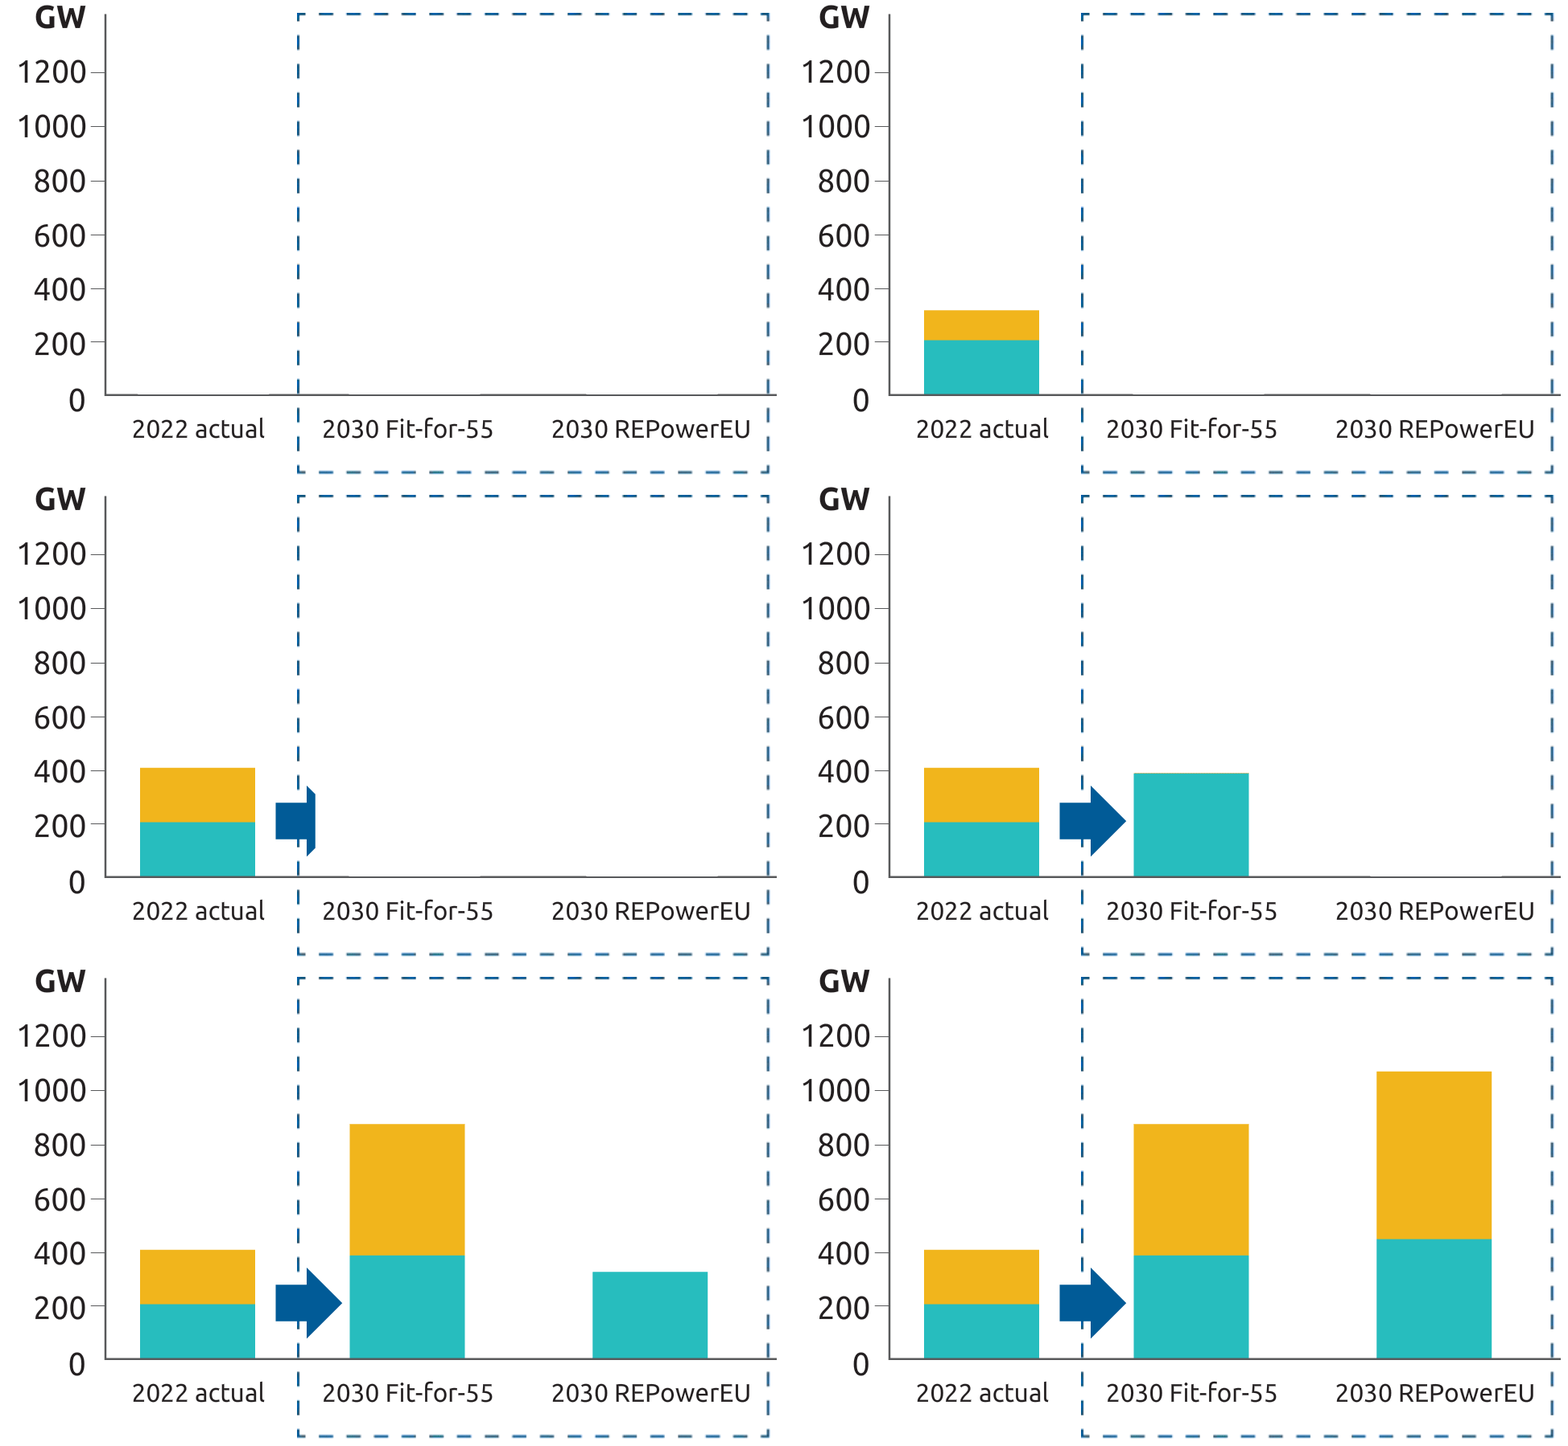
Approximate share of wind and solar in EU’s power generation mix (in TWh)
2022
From 1/5 to 1/2 of EU’s power generation
2030
Fit-for55 and REPower EU wind capacity figures for 2030 as revised by WindEurope downwards from initial commission’s estimates owing to turbine improvements. Originally: 427 GW and 510 GW.
Source: RAP figure. Author’s analysis based on Ember, EU Commission.
In this briefing, a deep dive in our Power System Blueprint, we explore the rationale for making wider use of smart-designed two-sided CfDs for non-dispatchable renewables (wind and solar) in European energy markets and propose a framework for assessing optimal CfD design.
We focus specifically on wind and solar, as two-sided CfDs are particularly well suited for low variable cost non-dispatchable energy sources with sufficiently large project pipelines. Further, we keep new nuclear out of scope of this paper, given its particular challenges and different risk profile.
The paper is structured as follows:
- Section 1 summarises main findings and recommendations.
- Section 2 discusses the rationale of introducing two-sided CfDs, explains their basic mechanics in comparison to other support schemes, presents recent auction results, underlines the importance of cost of capital reduction and discusses the role of corporate PPAs.
- Section 3 explores some of the policy dilemmas made apparent by the current energy crisis.
- Section 4 presents main CfD design elements and proposes a framework for optimal design choices, concentrating on the impact of CfDs on consumers.
This paper is accompanied by the related Blueprint Deep Dive ‘The search for an efficient two-sided CfD design efficiency – a Shakespearean history’ which points policymakers towards innovative CfD designs that minimise the market distortions that plague many of the older and less smart CfD designs.
1. Main findings and recommendations
Two-sided contracts for difference are well placed to be the go-to support mechanism for stimulating cost-efficient deployment of new renewables investment.
They are the only support mechanism that provides both downside protection for investors and upside protection for consumers. They are particularly effective in lowering the cost of capital and with it the cost of the energy transition.
Governments looking to increase participation in CfD auctions could consider:
- Carefully adjusting ceiling prices to take account of current LCOE (levelised cost of electricity) projections – this is an important first step and a no-regret strategy.
- Implementing structural measures that would put a capImplementing structural measures that would put a cap Like the inframarginal rent capture, windfall tax or other equivalent measures. RAP’s price shock absorber falls under this category. on renewables’ revenues – however while this could increase participation in CfD auctions it may bring unintended consequences for the investment climate and can ideally be avoided by addressing the most pressing problems (below).
- Mandating participation – however by closing the merchant route-to-market this would impede the energy transition and again is best avoided.
The absence of a quick fix here points to the importance of addressing the most pressing obstacles to renewables deployment – grid connection difficulties, supply chain challenges, slow permitting – as without solutions here, neither CfD auctions nor the market will deliver desired outcomes.
Both CfDs and long-term power purchase agreements (PPAs) have a role to play in supporting a quick build-out of renewables, and as such the regulatory framework should facilitate both. Removing unnecessary regulatory barriers to PPAs is a prudent strategy. However, intervention in the PPA market should be limited. In particular:
- We caution against providing state guarantees for PPAs. In order not to distort the market, the cost of these guarantees would have to reflect market prices (reflecting individual off-taker default risk), which in turn questions the additionality of government intervention.
- We consider PPAs should remain entirely market based and voluntary, and this suggests against introducing obligations on RES investors to offer part of their output into PPA contracts.
An important part of any CfD design is its financing of cost and disbursement of surplus. An approach that balances both efficiency and equity objectives and accompanying trade-offs may include:
- Disbursement of any surplus via annual lump-sum payments. This approach attempts to preserve efficient signals for short-term flexibility and long-term energy efficiency, and the visible nature of the payment has the additional benefit of underpinning public support for renewables.
- Prioritising low-income and vulnerable households with additional support for energy efficiency and smart electrification
In the accompanying CfD paper 2 we outline how CfDs can be designed in a system-friendly way, so that they minimise wholesale market distortions and ensure efficient dispatch, operation and investment decisions. To support this end, the European Commission may consider issuing a guideline for good CfD design and a simplified state aid approval procedure for compliant CfD designs to drive further harmonisation of RES support schemes in Europe.
2. Rationale for implementing two-sided CfDs
There are two powerful reasons to introduce two-sided CfDs as a default support mechanism for deploying wind and solar at scale:
- Two-sided CfDs are the only mechanism that provide both downside protection for investors and upside protection for consumers.
- Two-sided CfDs lower the cost of capital and therefore system cost of renewables’ expansion.
As PPAs have their own merits – offering advantages for off-takers, placing investment risk on investors rather than taxpayers (if they do not receive state guarantees), and being purely market driven are free from administrative CfD auction cycles – this therefore suggests a prudent strategy is to pursue a mix of PPA-driven and CfD-backed renewables deployment.
This section provides background on the thinking underpinning these conclusions. It sheds further light on the case for CfDs, outlines CfD characteristics and recent auction results, explores the influence of two-sided CfDs on the cost of capital for RES investments and considers whether PPAs on their own (without CfDs) would be sufficient.
2.1 Advantages of two-sided CfDs compared to other support schemes
Over the last 20 plus years European countries have introduced a plethora of different renewables support schemes to help meet their decarbonisation targets. Most popular over the years were feed-in-tariffs, where an appointed buyer would buy the whole output of a given RES generator at an agreed price and free the generator from any balancing responsibility. These were deployed in times when renewables were still a nascent technology and needed full de-risking in order to support speedy deployment. However, as the price levels were set up administratively and most of the time did not keep pace with technological developments (and resulting cost decreases), they proved more costly than necessary in driving the desired speed of deployment.
Another major type were tradable green certificate (TGC) schemes, a market-based instrument allowing RES producers to earn a premium on their generation by selling tradable certificates, which were bought by supply companies obligated by the state to cover a certain share of their sales. These instruments proved effective in some countries. However, Member States gradually moved away from them, linked to challenges in setting optimal targets in relation to the speed of RES deployment, which prompted price volatility and calls from investors for alternative tools to give them greater confidence.
The third instrument that gained popularity in recent years were feed-in premiums, whereby RES assets received a fixed or variable (sliding) premium on top of the captured market price — which worked well to protect the downside risk for the investor but did not protect consumers from high cost in times of elevated market prices.
Noting the cost of schemes with administratively set payments, the EU mandated in 2014 that support should in principle be awarded based on competitive auctions that provided optimal cost discovery. At the same time, Member States started to develop two-sided contracts for differenceMember States started to develop two-sided contracts for difference Two-sided CfDs were first introduced by the UK in 2014 which provided a blueprint for further applications (albeit with some significant variations, as discussed later in this paper). that provided consumer protection at high prices and that offered clarity and predictability for investors.
A two-sided CfD is a long-term financial contract between a public entity and an investor with settlement traditionally on energy generated. The settlement is between the agreed price for RES generation (the strike price, determined by auction and limited by an administrative ceiling price) and a reference price dependent on the wholesale electricity market. When the strike price is higher than the reference price, the investor receives a top-up from the central counterparty. When the strike price is lower than the reference price, the investor pays back the difference. The contract does not entail an actual buy-sell electricity relationship; the contract is purely financial. Figure 2 provides a graphical representation of the functioning of a two-sided CfD (far right) in comparison to other support mechanisms mentioned above.
Figure 2. Schematic representation of main types of RES support mechanisms
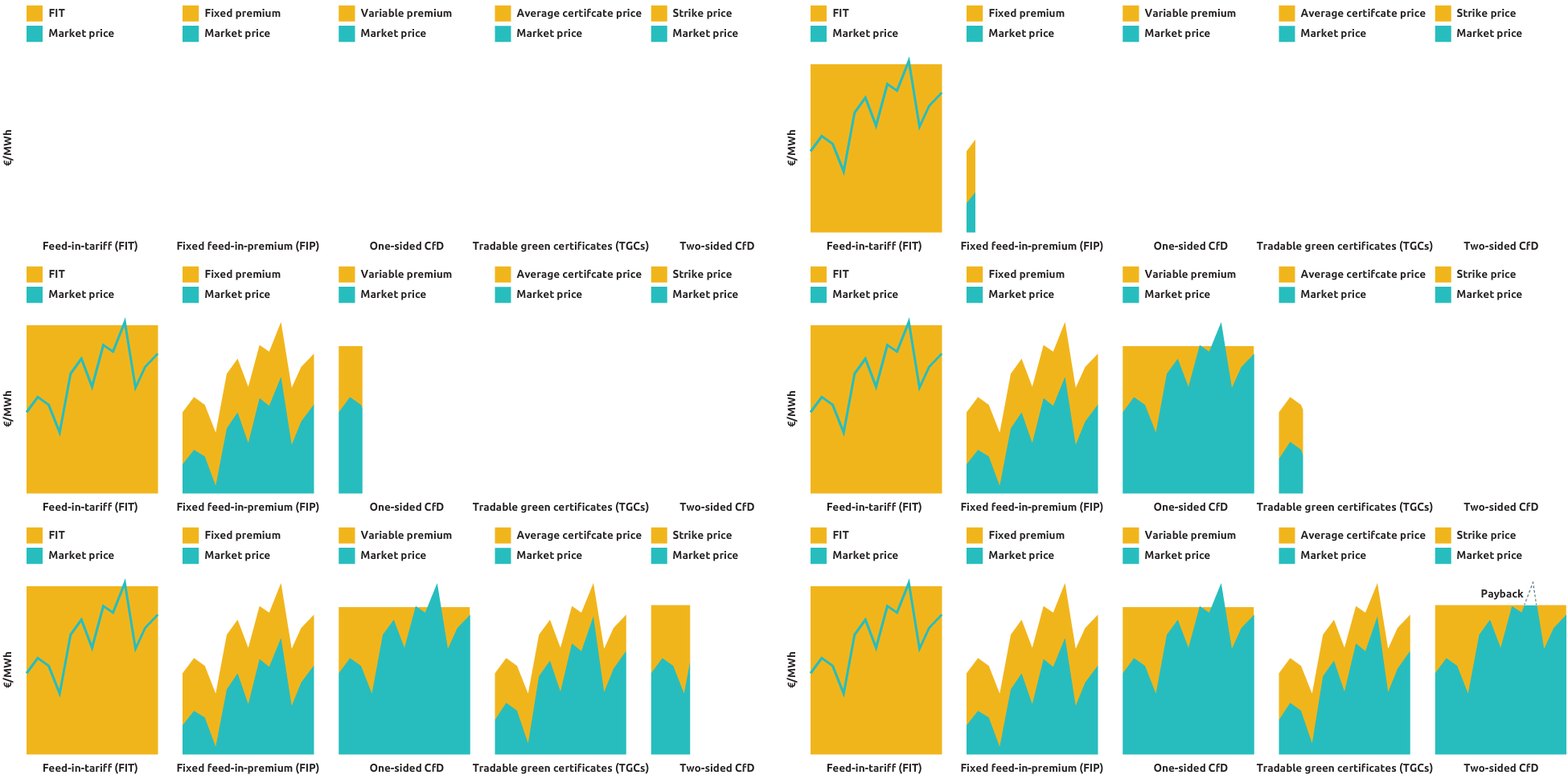
Source: RAP figure based on Joint Research Center.
The two-sided CfD is the only mechanism that provides both downside protection for investors and upside protection for consumers. This feature makes the CfD attractive in the current context of heightened price volatility. A two-sided CfD is a risk-sharing tool between consumers and investors. By providing revenue certainty, it protects investors when prices are low. This lowers the cost of capital and thus deployment costs, which in turn benefits consumers. And it shields consumers from prolonged periods of very high market prices by shifting revenues from generators to consumers, thus supporting affordability.
CfDs are particularly well suited for low variable cost non-dispatchable energy sources, notably solar and wind. It is only at close-to-zero variable cost that an investor is able to commit to a long-term fixed price contract without demanding a significant premium for fuel price risk — because the cost of generating electricity is largely fixed as the plant is constructed.
2.2 CfD performance – recent auction results assessed
By end of 2021, nine EU countries plus the UK were using two-sided CfDs. Recently, Belgium has also announced moving in that direction for the upcoming offshore wind auctions after considering the effectsdirection for the upcoming offshore wind auctions after considering the effects The Belgian government announced moving existing offshore projects from one-sided to two-sided CfD upon advice of the NRA CREG, in order to limit possible windfall profits. of the current one-sided support scheme. Romania has also announced its first CfD tender for the fourth quarter of 2023.
Figure 3 shows CfD auction results achieved in eight European countries from 2019 to Q1 2023. Even for the same technology and same auction year, there are significant differences between strike prices achieved. This is partly explained by fundamentals — such as differences in resource potential (less or more windy or sunny countries) or in cost of capital between countries stemming from country risk — and partly by differences in CfD design, which can be substantial and sometimes result in inefficiencies (as evidenced in Italy). Nevertheless, most of the strike prices achieved were within 50-70 EUR/MWh range, and thus quite attractive from a consumer perspective compared to wholesale power prices.
Figure 3. Auction results for two-sided CfDs for wind and solar generation between 2019 and 2023 (until April), EUR/MWh
Click on each country to see the auction results.
Notes:
We present these in nominal price form, as later we compare the auction results with nominal wholesale prices. If prices were to be deflated to the start of the period, real prices would be increasingly lower than displayed over the time period.
Whenever there was more than one auction conducted for a given technology, a simple average of auction results was used.
France: only auctions with price as a single selection criterion were considered, not multi-criteria.
Sources: RAP figure. Authors’ own analysis based on AURES database, PV Magazine, auctioning authorities’ websites.
We compare these figures with the range of average wholesale prices in European markets to provide context (Figure 4). This shows even in a pre-crisis environment, prices achieved at these auctions – and thus sustained over the duration of the contracts – were attractive for consumers, reducing their electricity supply costs over 2022 and 2023. Conversely, at the time of high wholesale prices, any one-sided support schemes (such as fixed and sliding feed-in premia) were generating very high revenues for renewable assets, causing a big economic welfare shift from consumers to producers and raising concerns of consumer affordability. This motivated the European Commission in September 2022 to propose a revenue limit mechanism with the inframarginal rent capture mechanismthe inframarginal rent capture mechanism The mechanism covered all inframarginal technologies, not just wind and solar.. The cap was set at 180 EUR/MWh, a multiple of strike prices achieved in CfD auctions.
Figure 4. Range of CfD strike prices achieved at auctions, EUR/MWh and a range of electricity spot wholesale electricity prices in Europe
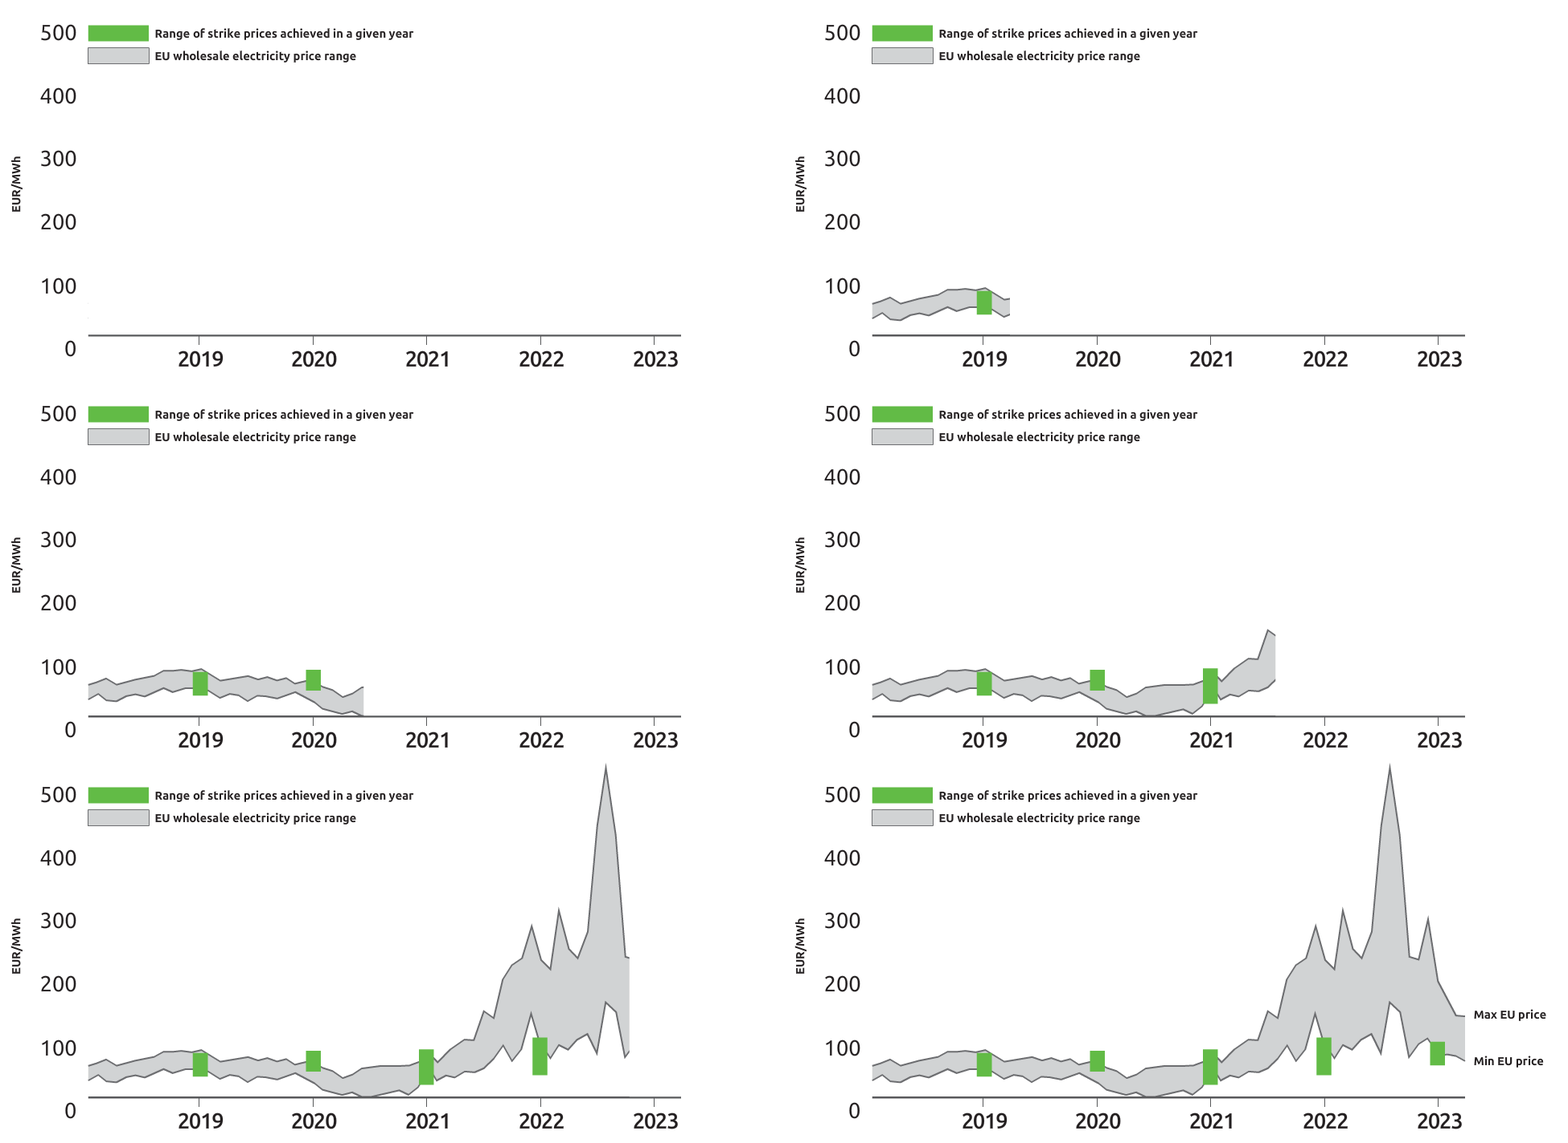
Contrary to the inframarginal rent capture mechanism, which is complex and fraught with legal challenges, the existing CfD schemes by design deliver consumer benefits during the period of high wholesale prices: RES investors are required to pay back to the central counterparty excess revenues achieved above the strike price. In the following box we list some of the recent examples where two-sided CfDs generated a surplus.
- In Portugal, RES procurement schemes resulted in a surplus in the amount of 2.5 billion EUR for 2023 that is being redistributed to household consumers through negative network tariffs — resulting in a significant discount on consumers’ bills.
- In the UK, RES investments under CfDs also delivered a financial surplus for the Low Carbon Contracts Company and the Interim Levy RateInterim Levy Rate per MWh charge to suppliers to cover payments which LCCC forecasts will need to be paid to renewable CFD generators. was set at 0 GBP/MWh from September 2021 through March 2023.
- Commission de Régulation de L’Energie (CRE), the French energy regulatory office, evaluated in July 2023 the surplus to be collected over 2022-2023 from RES investors at close to 6 EUR billion.
- In Denmark, the surplus accumulated from the three offshore wind farms’ CfD scheme was estimated at about 700 EUR million for 2022 alone.
- In Poland, the Energy Regulatory Office (ERO) set the RES levy on consumers’ bills at 0 EUR/MWh for 2023 due to the surplus accumulated from CfD clawbacks.
In summary, CfDs have supported low-cost renewables deployment and have the capability to shield consumers from high prices.
2.3 Influence of two-sided CfDs on the cost of capital for RES investments and thus total cost of transformation
Securing stable revenues is the main prerequisite to obtain (low-cost) financing for RES projects. A notable attraction of CfDs from the perspective of RES developers is that they significantly reduce price risk, an important driver of revenue risk, and arguably the biggest single risk RES investors face. On many other counts, wind and solar investments are comparatively low-risk endeavours. Although their development phase (conducting necessary studies and obtaining multiple permits) can vary considerably and be quite lengthycan vary considerably and be quite lengthy According to the Ember report permitting times in the EU vary between 12 and 48 months for solar and between 30 to 120 months for wind. these investments are relatively low cost (with the exception of offshore wind, thus potentially meriting special treatment). The construction phase itself is now relatively low risk, repeatable and quick, with controllable costs and no major risks of cost and time overruns because the industry matured and supply chains, skills and investment procedures are well established. And since there is no fuel cost to these technologies, it is the construction cost and the corresponding financing cost that makes the bulk of their levelised cost of electricity (LCOE).
Whereas there will always be variability in the measured output due to changing weather patterns, with good wind speed and solar irradiation analysis this is well understood and can be fairly reliably projected over the lifetime of these assets. And although volume and price risk are negatively correlated (i.e. in a low wind year wholesale prices tend to be higher than in a high wind year), the overall price risk remains the one that is the least controllable and least predictable. Thus reducing price risk dramatically reduces the cost of capital (and in many cases renders the project bankable). As fixed costs, and thus the cost of capital accounts for such large portion of variable renewables lifetime cost, CfD support can make a particularly significant impact in reducing deployment cost for these technologies. Figure 5 (left-hand side) compares the composition of cost between illustrative fossil fuel and variable renewables electricity generating technology, and (right-hand side) shows for the latter the impact of cost of capital on lifetime cost.
Figure 5. LCOE composition for illustrative assets and impact of changing financing cost on RES lifetime cost
Distribution of different cost types over the lifetime of energy assets
(rough example, representative for a solar PV / wind plant, at 6% CoC)
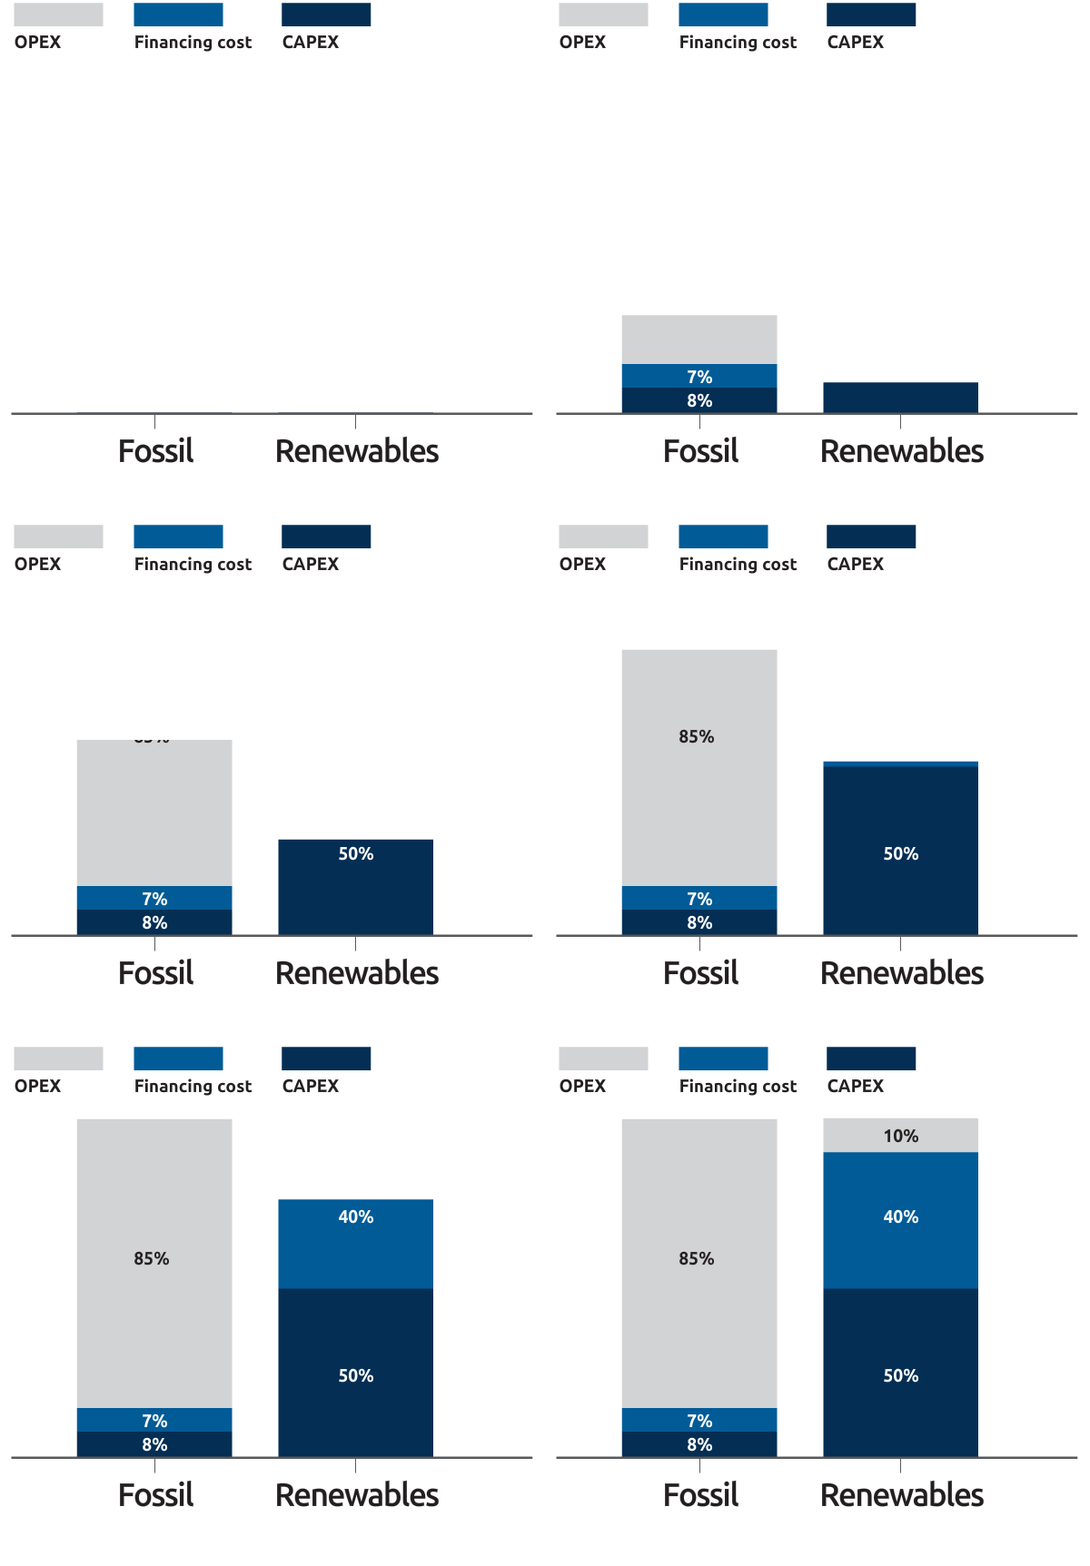
Renewable energies have a much higher share of capital expenditures (CAPEX) and financing cost (CoC)
Impact of financing cost on levelised cost of electricity for renewable energy assets
(rough example, representative for a solar PV / wind plant)
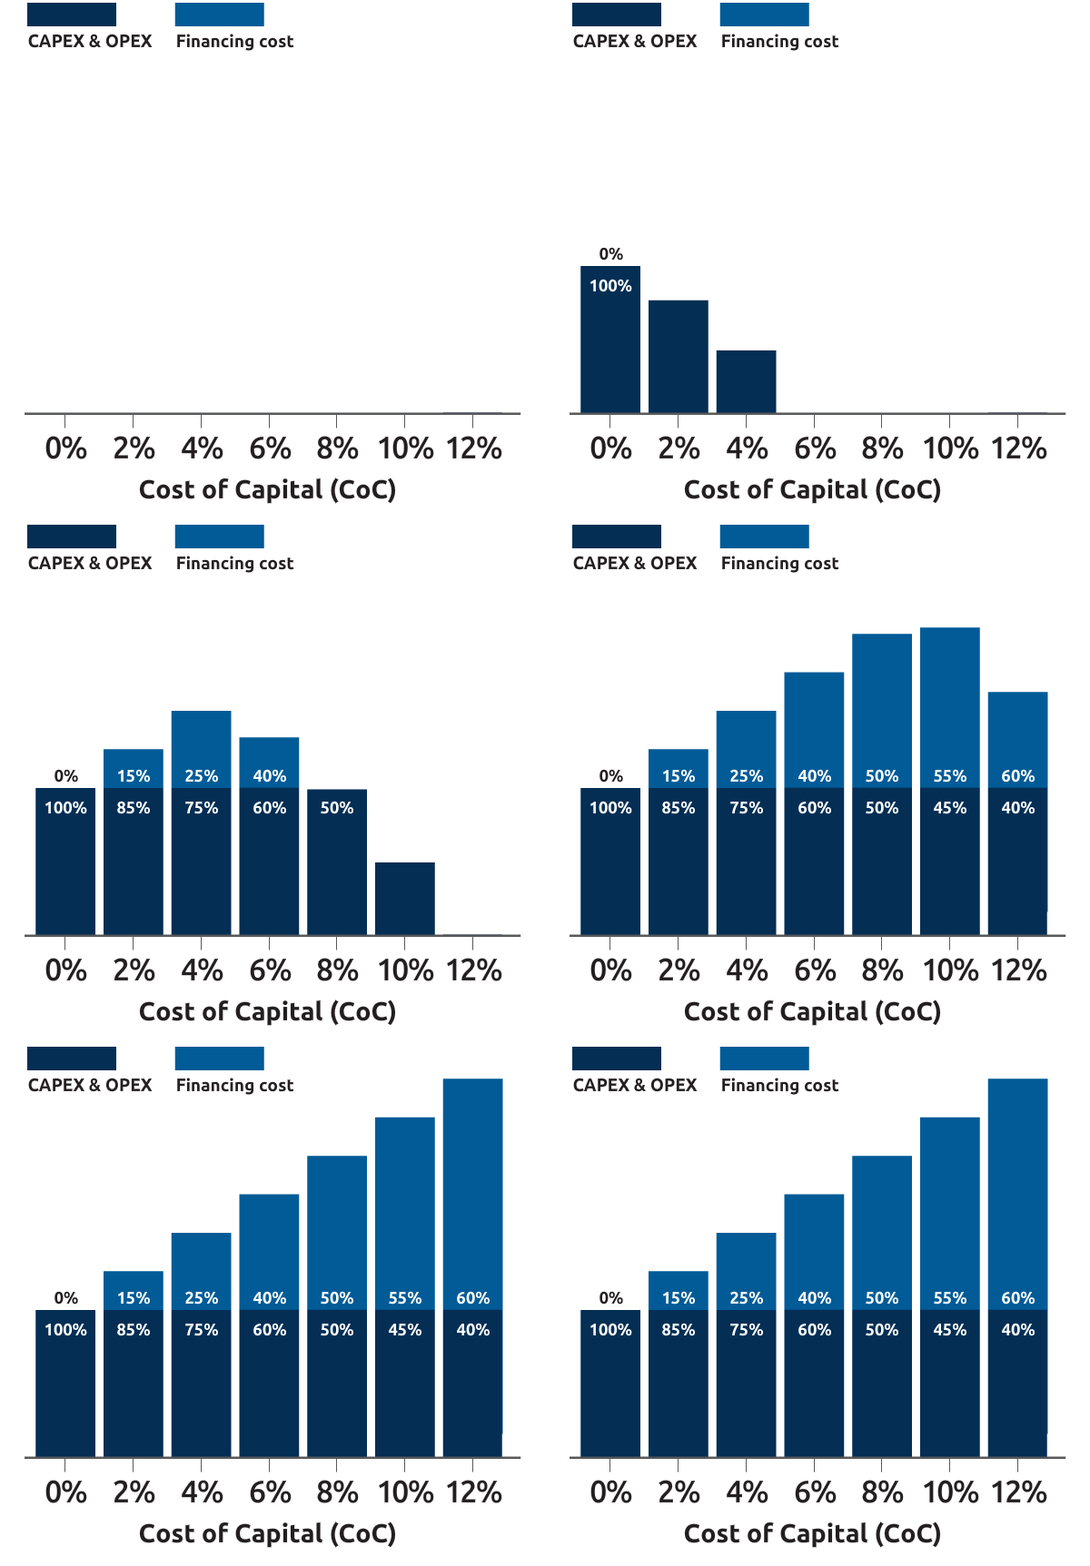
The share of financing cost (CoC) in average lifetime cost (LCOE) escalate quickly with increasing interest rates
Source: Lena Kitzing presentation at an FSR webinar, adapted from Egli, Steffen and Schmidt, (2021). Recreated with permission.
The cost of capital consideration is especially important when we compare merchant investments (relying only on market revenues) with investments supported by a two-sided CfD.
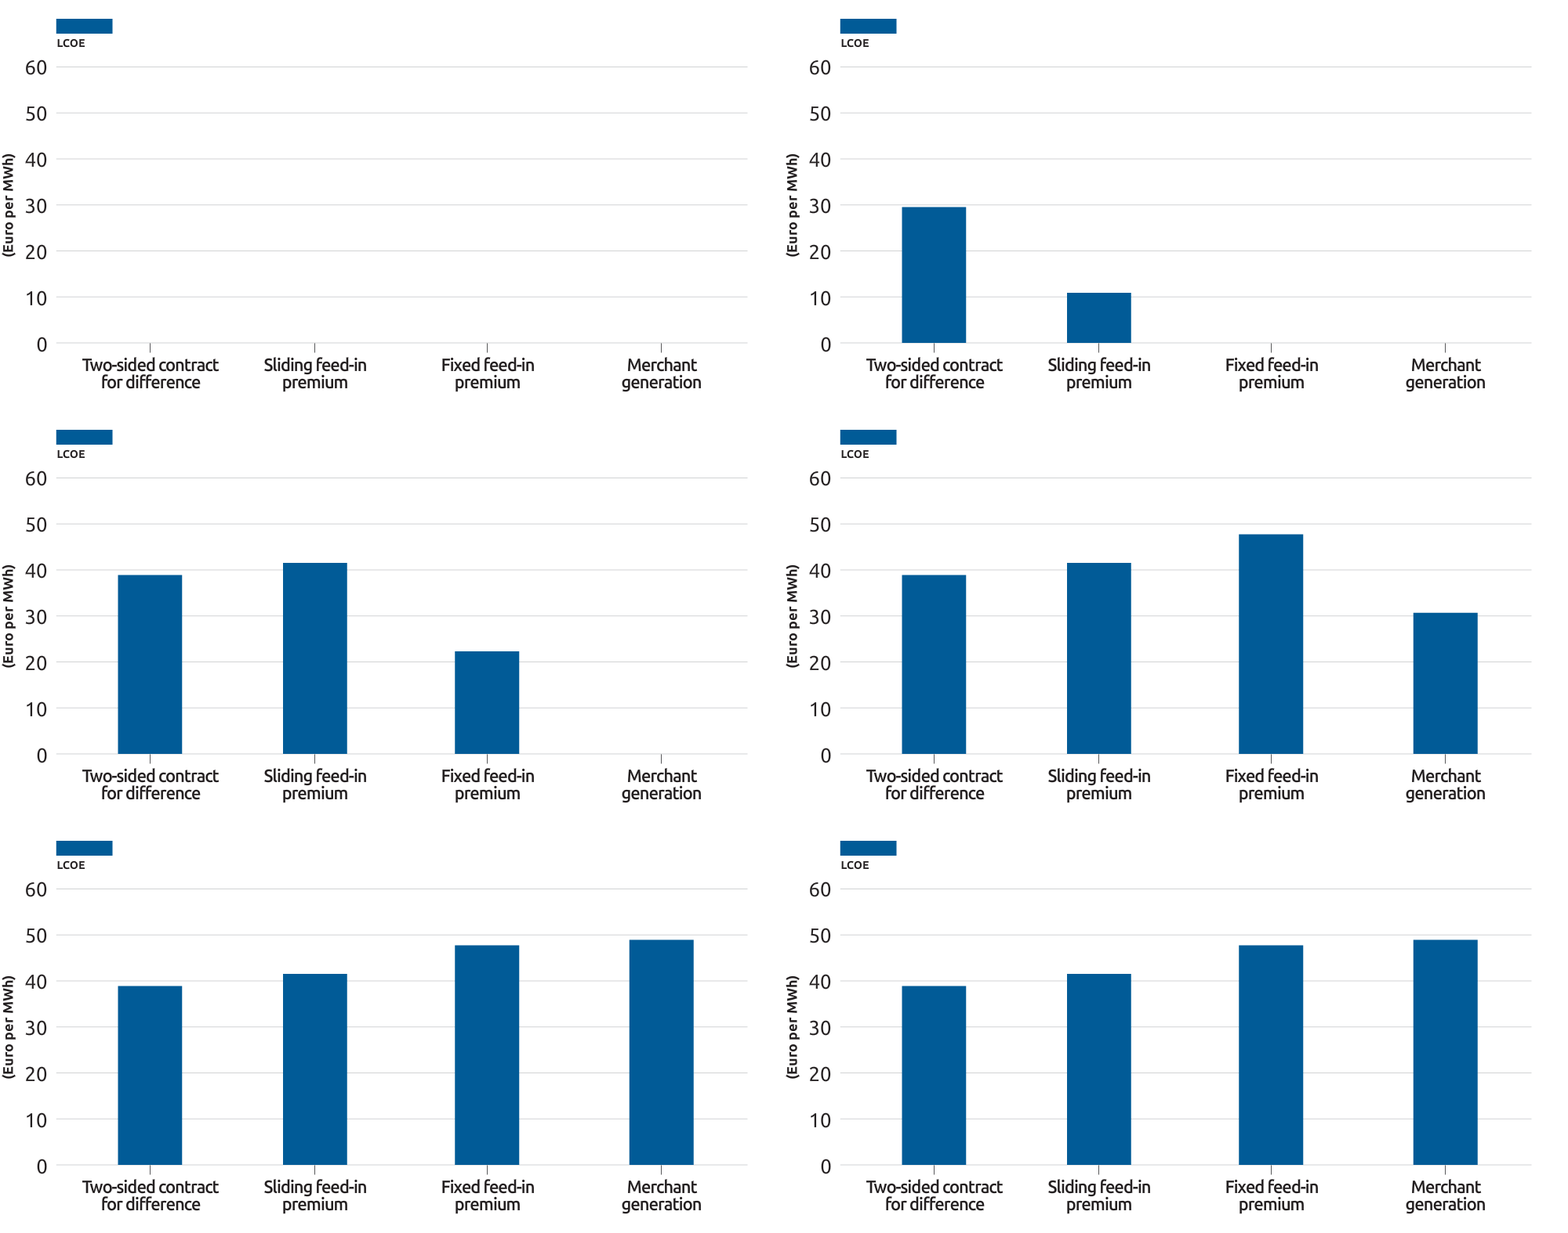
Figure 6 illustrates the impact of a chosen support scheme on LCOE of onshore wind in Germany. The highest LCOE (and thus highest cost for consumers), reflecting the highest risk, is for merchant generation, and the lowest for two-sided CfDs. As a result, it is estimated that consumers would save 3.4 billion EUR annually by 2030 if RES deployment in Germany is supported by two-sided CfDs rather than being fully merchant. The difference is much smaller between a two-sided CfD and a sliding premium. However, in a high wholesale price environment, sliding premiums result in extraordinary revenues for RES investors at a high cost for consumers, whereas for CfDs the net consumer cost will be unchanged.
Figure 6. Levelised cost of onshore wind power under the different remuneration mechanisms
Source: Adapted from Neuhoff K., May N., Richstein J.C., (2022). Financing renewables in the age of falling technology costs. Resource and Energy Economics, 70, 101330
Similarly, a recent UK report examining the risks investors and consumers face on a pathway to net zero in the UK estimates that with every 1 percentage point increase in the cost of capital, the cost of deployment of UK’s offshore wind by 2040 increases by 1 billion GBP per year.
All of this suggests that CfDs can have a significant impact in limiting the cost of the clean energy transition by keeping the cost of capital in check.
2.4 Would PPAs do the trick alone?
Given the recent elevated wholesale price environment, it might be argued that merchant renewable generation — whether fully based on organised market revenues or underwritten by private power purchase agreementsprivate power purchase agreements For the purpose of this analysis, we define power purchase agreements (PPAs) as a long-term energy supply contract signed by a renewable investor and corporate or utility off-taker, which is usually medium to long-term (five to 20 years). — should be the only way for renewables to be deployed in the future and that no government-backed, de-risking instrument is needed.
Despite some recent instances during the energy crisis, fully merchant renewable generationfully merchant renewable generation We define merchant investment as one without any sort of government support; “fully merchant” thus means relying only on wholesale market revenues, without any sort of long-term power purchase agreement. is very rare and makes up only a very small fraction of projects globally. PPAs, however, are a very compelling proposition, and as such, governments might thus be tempted to rely solely on PPAs to provide a route-to-market for renewables. Positive traits of PPAs include:
- They have been fully driven by markets, with no government involvement and thus risks are only borne by consumers where they choose to do so.
- They provide some revenue stability for investors (depending on the length of the contract) and thus support project financing.
- They are efficient at meeting off-takers’ increasing demand for green electricity.
Relying solely on PPAs however presents challenges and risks, and as such a regulatory regime that provides for government backed CfDs as well is preferable.
First, well-designed support schemes can be effective in lowering the cost of capital and transaction costs and reducing the cost of the energy transition.
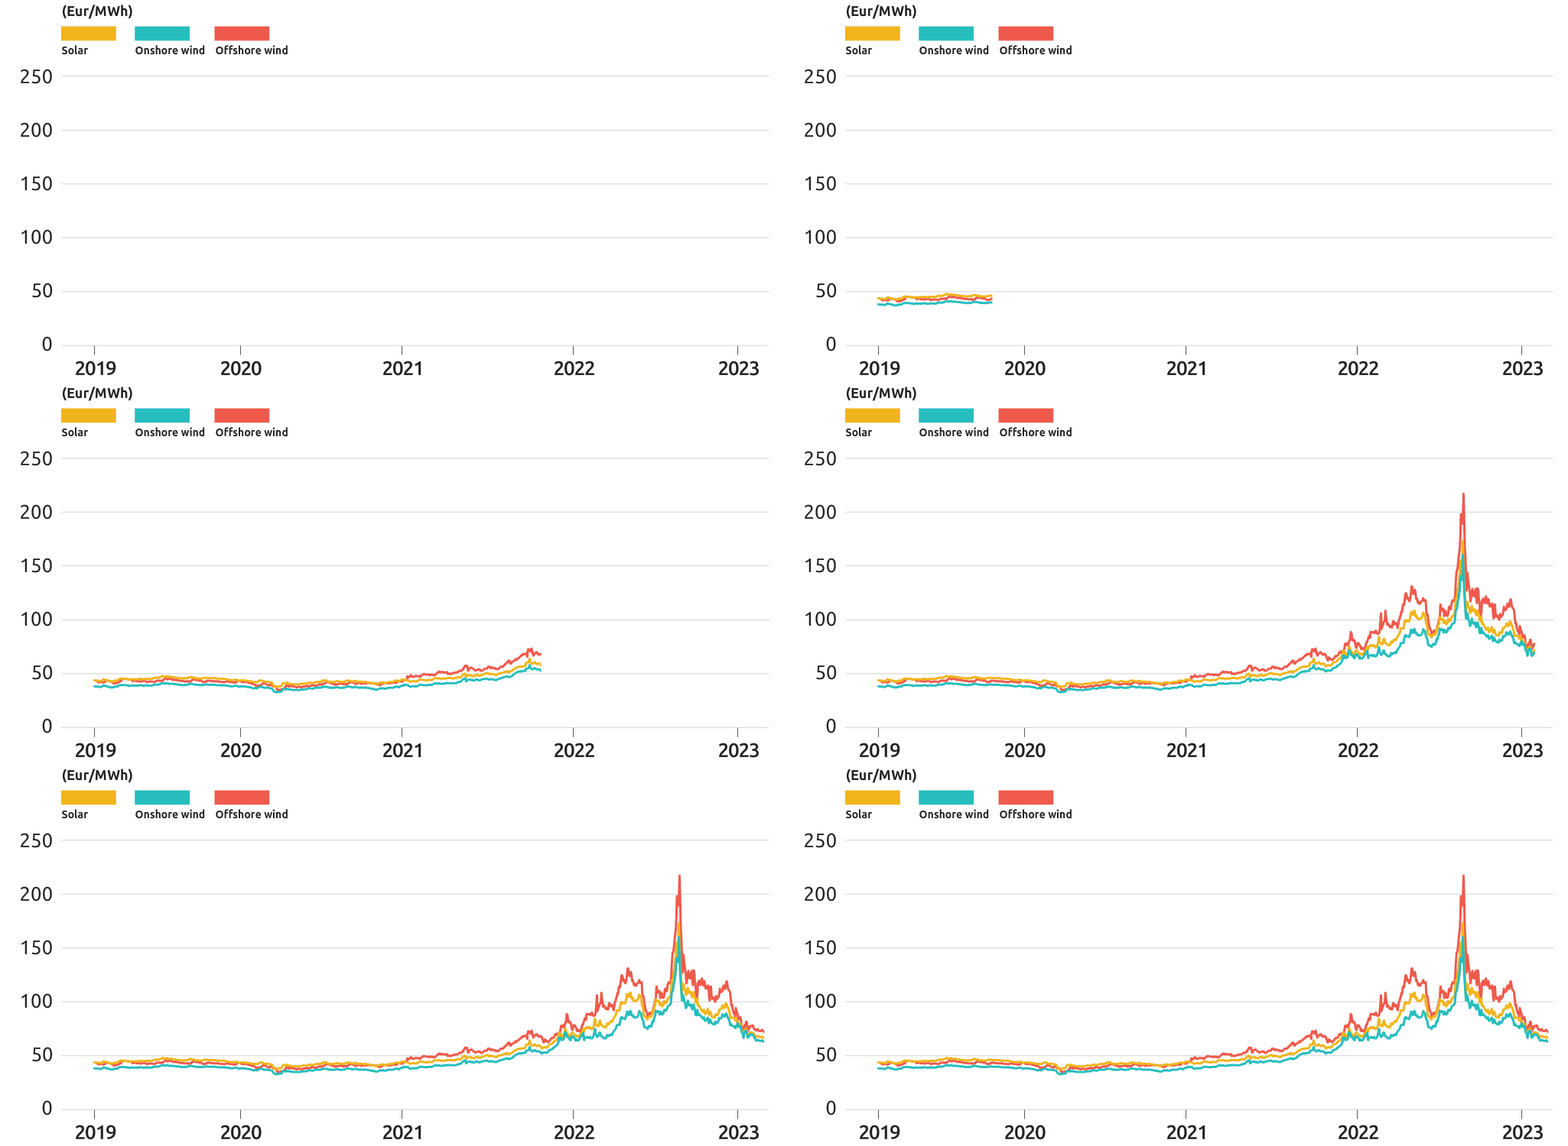
Second, even when market prices are buoyant, and many investors are resisting striking CfD contracts in order to strike PPA contracts at high prices (for instance late 2022, see Figure 7), providing a CfD route-to-market can still allow for lower cost investments for the subset of more risk averse investors, and thereby save consumers costs.
Figure 7 . Trend indicator for a standardized 10-year PPA weighed for technology (Pexapark's Euro Composite Index)
Source: Franke, A. (2023, 2 March). INTERVIEW: European PPA market could see record deals in 2023: Pexapark.
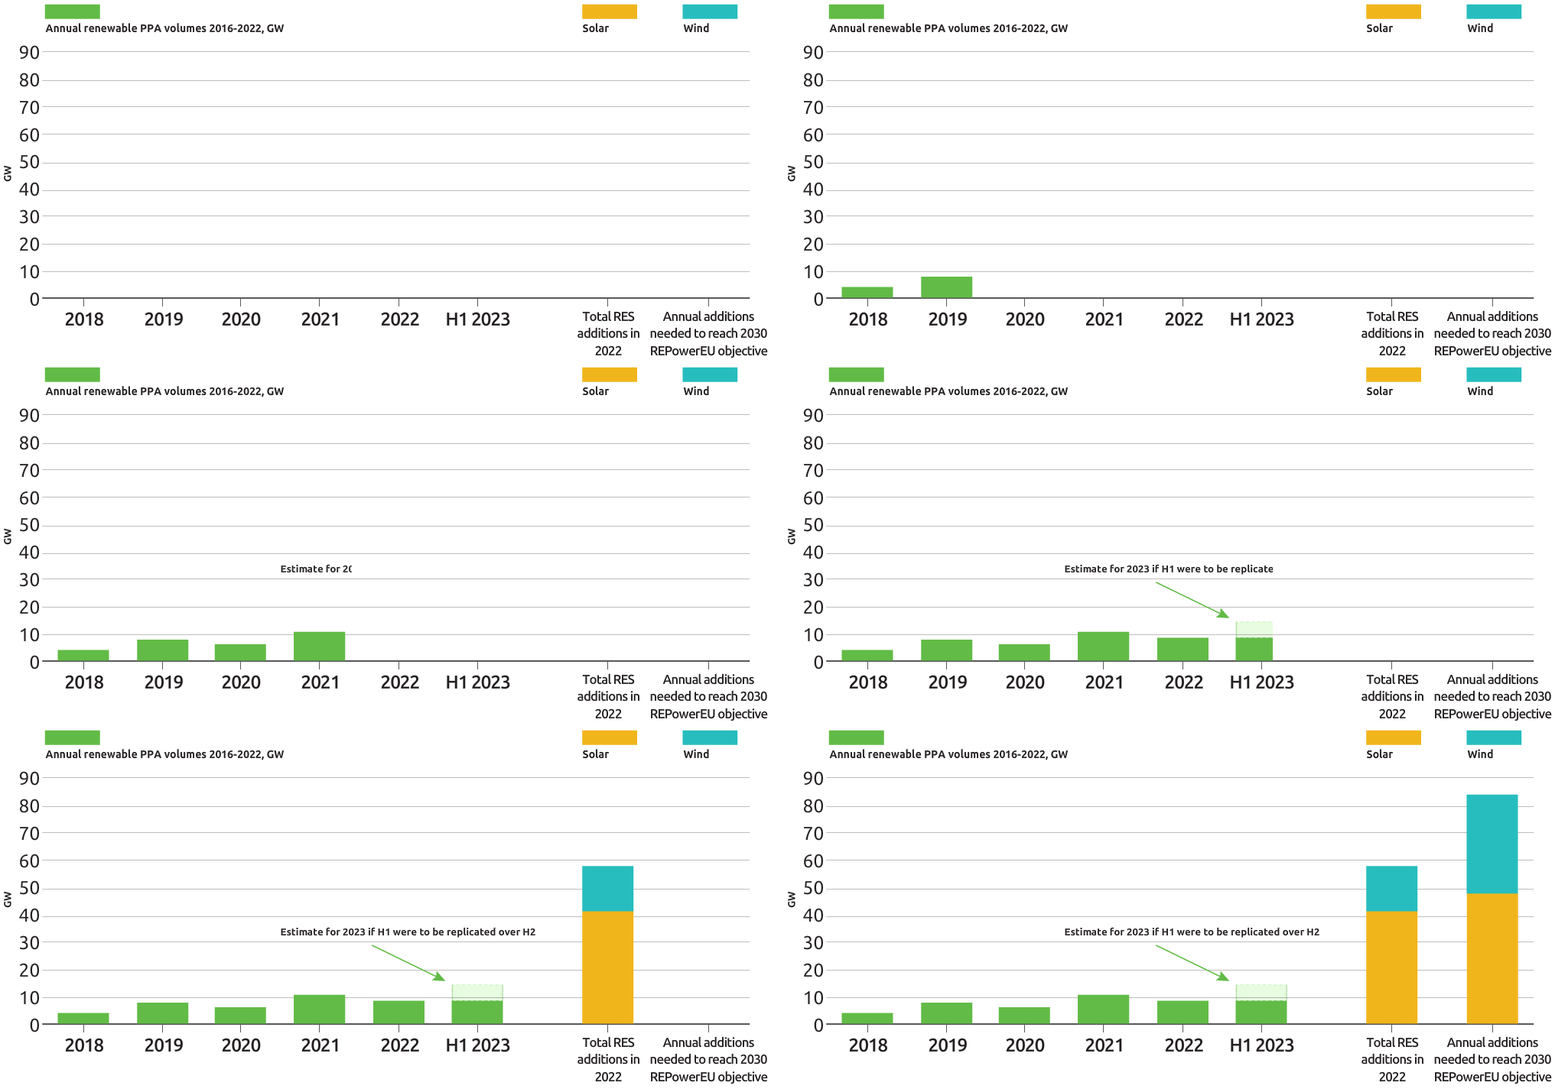
Third, for PPAs to be able to address the needs of all consumers, they would need to be adopted not only by large industrial and commercial off-takers but also by suppliers serving the wider market. The dramatic drop in the number of utility driven PPAs in 2022 underlines the scale of the challenge here, noting PPA uptake in Europe is still orders of magnitude short of the scale of RES investment needed over coming years as embodied in RePowerEU goals (Figure 8). Although household and small and medium-sized enterprises could in principle be served by utility-driven PPAs, the drivers behind the lack of willingness of suppliers to enter into longer term PPAs are significant, including elevated perceptions of risk and accompanying cost, and prohibitions on fixed-term supply contracts for households exceeding two yearsfixed-term supply contracts for households exceeding two years With the exception of large incumbents with a stable and largely captive customer base in some markets.. While targeted reforms might help facilitate the striking of long-term PPAs by suppliers, in the meantime, support schemes such as CfDs will help underpin regulatory confidence that renewable targets will be met.
Figure 8. Annual total PPA volumes 2018 – Q1 2023 (GW) versus actual RES build-out in 2022 and REPowerEU annual capacity additions target
There is a live debate on the merit of regulatory interventions in the PPA market. While unnecessary regulatory barriers to corporate PPAs should be removed (such as those stemming from guarantees of origin implementation), there is not a strong rationale for providing state guarantees for PPAs (a proposal currently under consideration). This is because a CfD route to market exists which provides for a fairer allocation of cost and benefit to those underwriting the investment. Furthermore, in order not to distort the market, the cost of guarantees would have to reflect market prices (reflecting individual off-taker default risk), thus questioning the additionality of government intervention. Similarly, caution may be warranted in introducing any obligations on RES investors to offer part of their output into PPA contracts. While government can endeavour to address barriers to the PPA market, help standardise contracts or pool demand, PPAs should remain entirely market based and voluntary.
In summary, PPAs offer many advantages for offtakers, do not pose risk for consumers (if they do not receive state guarantees), and being purely market driven do not rely on administrative cycle of CfD auctions. At least for some time they will not be enough to support the full extent of RES buildout, and therefore pursuing a mix of PPA-driven and CfD-backed renewables deployment presents an attractive strategy.
3. Policy dilemmas
In this section, we consider policy dilemmas that confront governments and regulators striving to ensure that CfDs play a meaningful role in protecting consumers from price shocks and to lower deployment costs by enhancing confidence in the investor and financing community.
3.1 Strategies to support participation in CfD auctions in a high-price environment
Recent CfD auctions have been undersubscribed – see box below. This is focusing minds on strategies to ensure greater participation.
- Greece awarded only half of the intended 1 GW capacity at a September 2022 auction.
- A Spanish auction in November 2022 awarded only a tiny fraction (45 MW) of the 3.3 GW capacity originally intended3.3 GW capacity originally intended Market participants cited reserve price of 47 EUR /MWh as too low..
- At the Polish auction in December 2022 only 25% of target energy was procured.
- A French auction in April 2023 for ground mounted solar awarded only 115 MW of capacity against initial expectations of 925 MW (and that at a high average price of 82 EUR /MWh, against 69 EUR/MWh in the previous round in 2022).
It is likely that many RES investors (especially those developing solar projects with the fastest delivery times) opted rather for staying fully merchant or for signing long-term PPAs with corporate or utility off-takers, in order to secure higher revenues than those offered by the CfD schemes. This may have been driven to some extent by CfD ceiling prices set below prices that could be struck in the market (to the extent they implied lower revenues even after adjusting for cost of capital reductions), or even below break-even cost (given rising commodity costs in 2022). Some investors offered only a part of their prospective production into a CfD auction and sold the rest on the market or under a PPA.
Governments are keenly aware that low participation in CfD auctions in times of high wholesale power prices can see extraordinary revenues for RES projects, and an economic welfare shift from consumers to investors compared to the hypothetical counterfactual where investment is realised at a modest internal rate of return through participation in a CfD auction. Furthermore, weak competition in CfD auctions may add to increases in strike prices (towards the opportunity costs of merchant revenues subject to hit ceiling prices).
Governments may therefore consider options to stimulate participation in CfD auctions, including:
- Raising ceiling prices in CfD auctions in order to attract investors (option 1).
- Capping merchant revenues with introduction of a permanent regulatory intervention (in the form of inframarginal rent capture, windfall tax, price shock absorber or similar) that would send a signal to investors that extraordinary profits will not be allowed (option 2).
- Require CfDs for new build or otherwise require investment in grid upgrades and storage investments (option 3). This is a variant on option 4.
- Making CfDs mandatory for new RES generation (option 4), thus introducing a CfD auction as a necessary permitting step for RES investments.
Figure 9 shows each option has drawbacks.
Figure 9. Options to increase participation in CfD auctions in a high wholesale price environment
Option 1
Raise reserve/ceiling prices
Drawbacks
Option 2
Introduce a permanent regulatory intervention addressing extraordinary profits
Drawbacks
Option 3
Make CfDs mandatory for new generation or require additional grid upgrades / storage investments
Drawbacks
Option 4
Make CfDs mandatory for new generation
Drawbacks


Option 1
Raise reserve/ceiling prices
Drawbacks
Option 2
Introduce a permanent regulatory intervention addressing extraordinary profits
Drawbacks
Option 3
Make CfDs mandatory for new generation or require additional grid upgrades / storage investments
Drawbacks
Option 4
Make CfDs mandatory for all new generation
Drawbacks
Source: RAP figure.
The first option – ensuring ceiling prices are not excessively tight – is a no-regret and necessary step. We recommend periodic review of ceiling prices to ensure they are informed by current LCOE estimates, accounting for variations in technology costs and rising interest rates. Governments should nevertheless be aware that while this removes an unnecessary obstacle to CfD participation, during times of high market prices, volumes participating in CfD auctions may nevertheless be diminished.
We caution against introduction of a long-term regulatory instrument (option two), which would make it explicit that no windfall profit can be pocketed for RES investments. Although this would enhance the relative attractiveness of CfDs, this option could result in a deterioration in the investment climate for renewables in Europe and thus slow down the pace of investment.
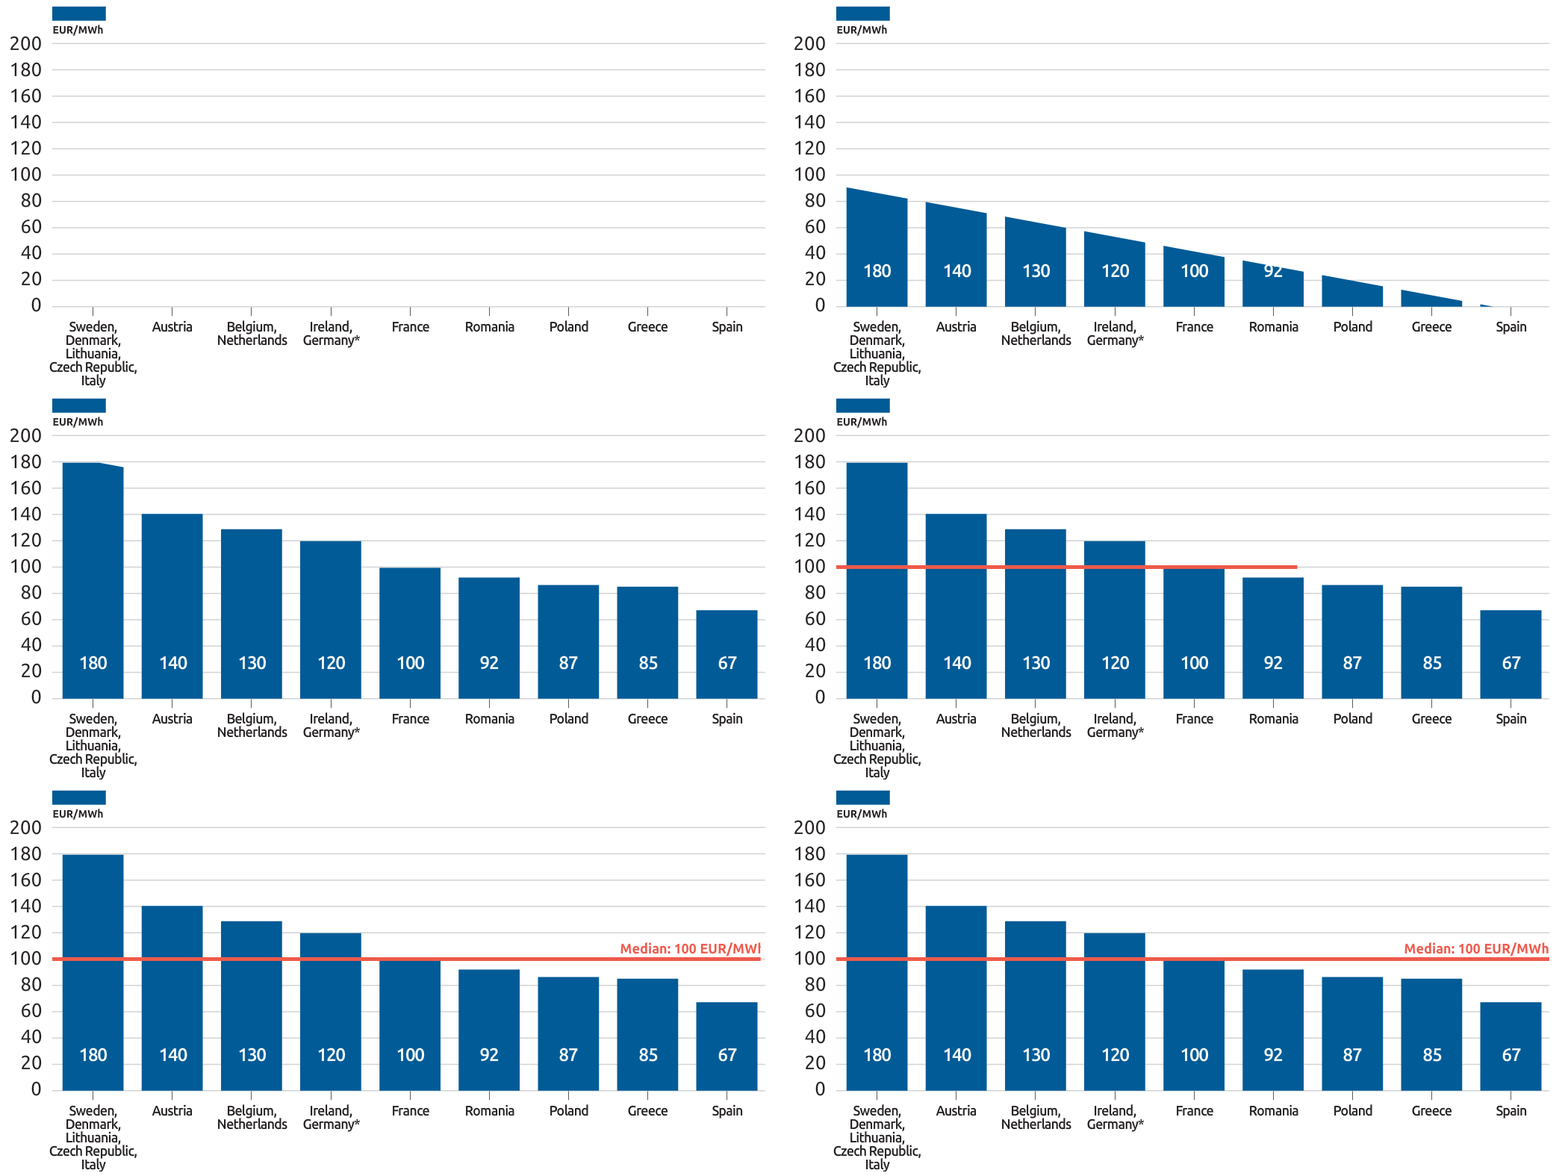
To some extent, the 2022 governmental interventions on the electricity market have already changed perceptions of regulatory risk. The temporary EU-wide revenue cap of 180 EUR/MWh (Figure 10), unevenly implemented across the EU, has introduced significant uncertainty for RES generation.
This should be accompanied by long-term visibility for investors through the scheduling of auction volumes years in advance and permitting reform to ensure predictable project development timelines.
Figure 10. Implementation of the revenue cap for merchant solar generation across the EU, EUR/MWh
Source: Pexapark. (2023). European PPA market outlook.
Higher regulatory risk might increase the willingness of investors to trade possible higher revenues for regulatory stability — a kind of insurance against possible price caps and windfall taxes (as these are not applied to renewables under CfD schemes).
We skip option 3 here, which we return to later, as it builds on the simpler option 4, which we turn to now. Some of the recent discussions around electricity market reform have centered around the question of whether to make use of CfDs mandatory for all new RES developments (option 4). We recommend that two-way CfDs should be made the default support scheme for new projects, but caution against making them mandatory, that is, forbidding new merchant generation, as this would impede efficient routes to market including PPAs. Furthermore, it brings with it the risk that should governments underestimate RES potential and with it volumes to procure in CfD auction, the sum of renewables investment delivered could be significantly less than if merchant investment is allowed to flourish simultaneously.
Portugal has pursued an interesting approach (option 3), where in order to receive a grid connection, investors either have to compete in a CfD auction, or if opting for a merchant route have to contribute to the necessary grid upgrade or integrate storage into the projectintegrate storage into the project In the 2020 this “flexibility option“ – integrating storage to the solar investment proved very popular (72% of awarded capacity fell under this scheme).. It remains to be seen whether this approach is efficient at delivering the necessary amounts of clean generation.
An alternative approach is to wait out the current storm of high power prices (‘do nothing’) and allow merchant RES generation to reap extraordinary profits in the hope of attracting more investors and thus speeding up the energy transition. This will not however automatically translate into more investments because of permitting and grid connection constraints. This points to the most significant obstacles impeding RES investment – permitting and grid connection constraints – and the importance of addressing these deployment obstacles at root. Doing so could help significantly in bringing down prices in wholesale markets, PPAs and CfD auctions.
In sum, this suggests periodic review of ceiling prices, realism about the prices at which CfDs can deliver new investment (absent undesirable interventions that risk chilling market routes for renewables altogether), and reform to address the most pernicious obstacles to deployment – in particular targeting permitting and grid connection issues.
3.2 CfDs for existing generation
There are two broad reasons for considering applying CfDs to existing generation:
- The perception of governments of an urgent need to limit extraordinary shifts of money from consumers to existing generation.
- The willingness to provide revenue certainty for projects that are facing lifetime extensions or repowering decisions.
Approaches to force existing generation under CfD contracts — be it from merchant, a one-sided feed-in-premium, a green certificate scheme, or an investment nearing the end of its FiT term — could be challenging to implement in a way that does not violate investors’ acquired rights and undermine investor confidence. This suggests against forcing retroactive changes to support schemes, as this would undermine investor’s confidence and increase perception of regulatory risk, which is one of the drivers of cost of capital for the whole sector.
Governments may nevertheless wish to design special CfD auctions for existing generationauctions for existing generation This has been done in Poland in the past, albeit with limited success. — in the hope of attracting assets that would gladly trade short term gains for longer term stabilitygladly trade short term gains for longer term stability We note the attractiveness of this option will be influenced by whether some of the temporary interventions limiting inframarginal rents are perceived as likely to become permanent.. This would require difficult choices in setting ceiling prices and defining eligibility criteria such as the minimum amount of investment required.
4. CfD design
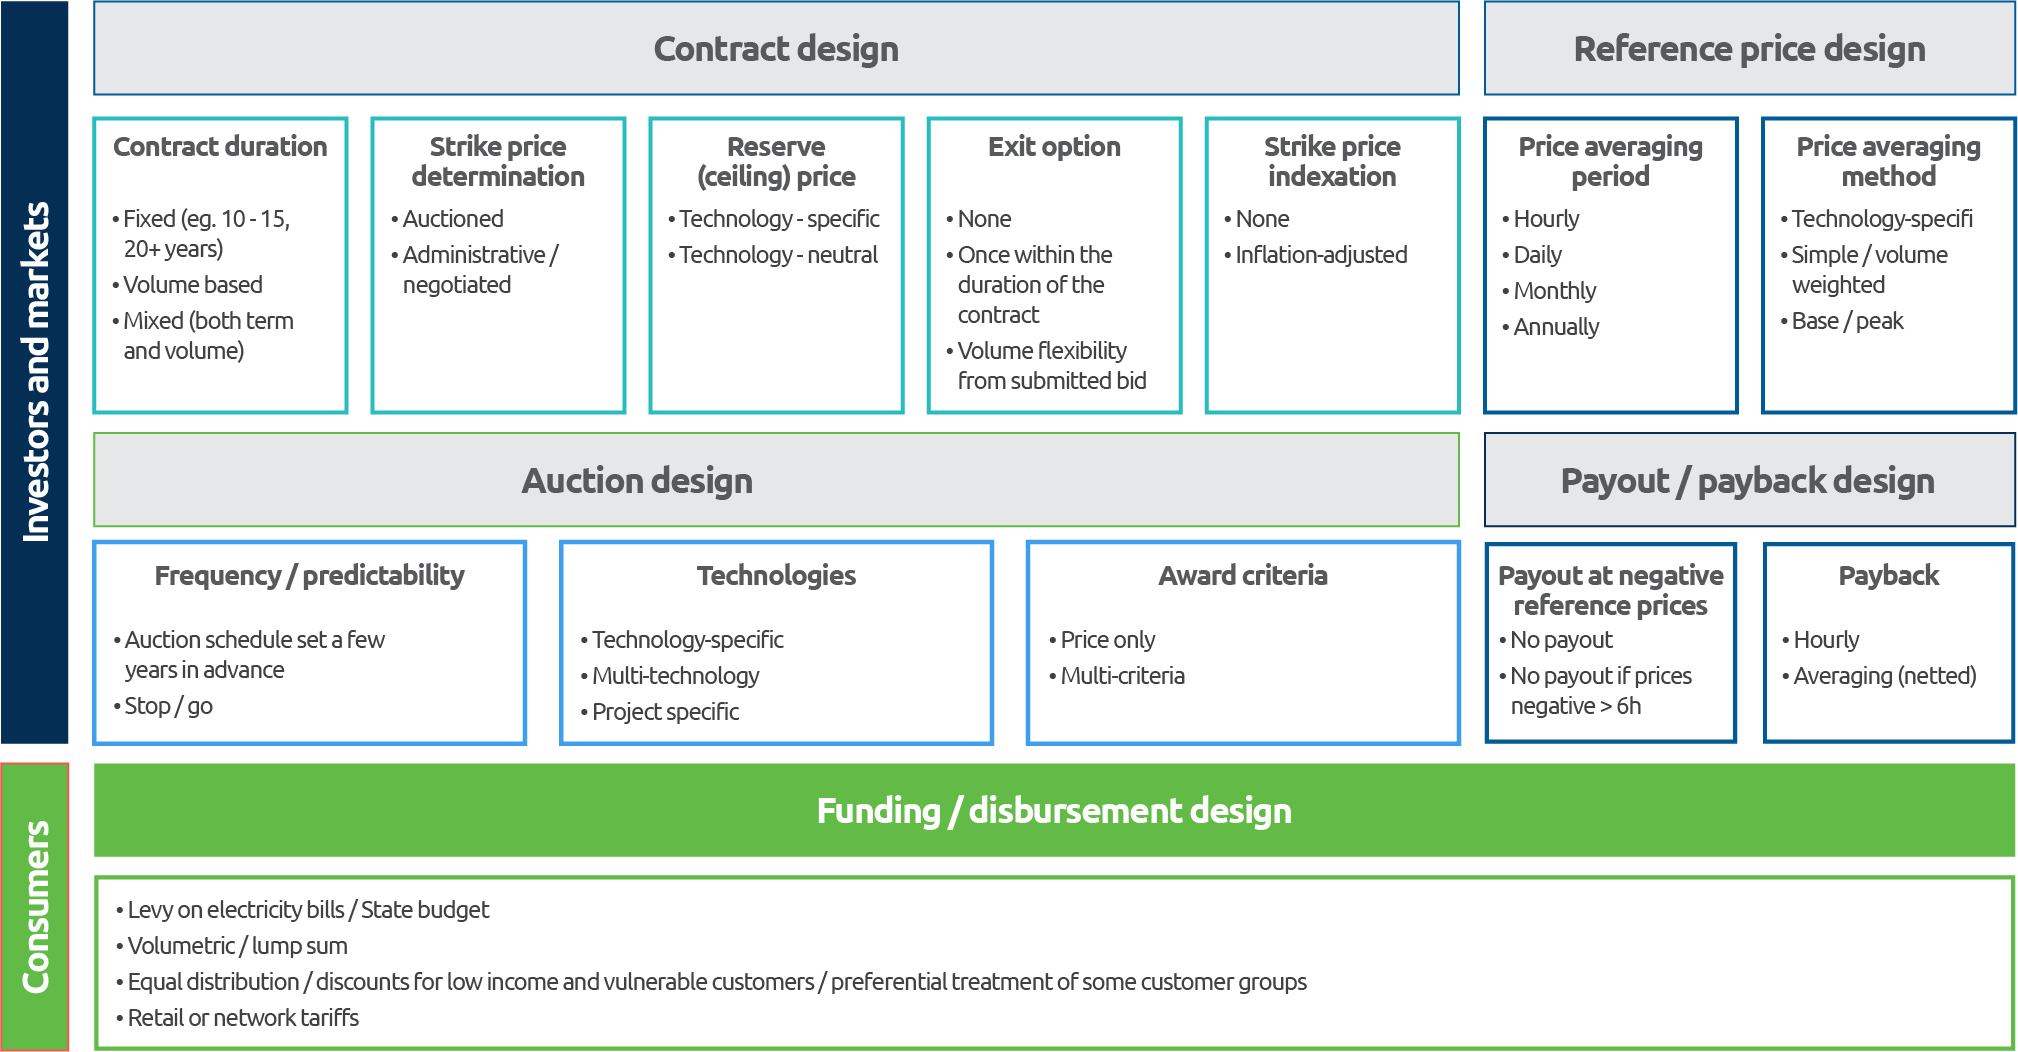
CfDs require careful design to support rapid RES expansion at lowest system cost. There are several main design blocksThere are several main design blocks There is a wider array of design features than presented in Figure 11, for example differences in time allowed for project completion, financial penalties for non-completion, prequalification conditions, bid volume sizes, and so on – which we do not examine in this paper, but which also influence outcomes. to be considered, as presented in Figure 11 below, which involve tradeoffs and can lead to different outcomes (as shown in section 2.2).
Figure 11. Main design elements of traditional CfDs
Source: RAP figure.
4.1 Good CfD design – tradeoffs
There are multiple elements to consider in designing CfD contracts and auctions that drive RES expansion at lowest possible cost. We focus in particular on design features that support efficient interactions with wholesale markets and underpin efficient dispatch, maintenance and investment decisions. Good CfD design can support efficient and equitable outcomes, building on informed choices in relation to the tradeoffs to be made. Good CfD design also requires paying attention to funding the deficit when wholesale prices are low and also disbursing the surplus when they are high – as they have been in recent years.
We therefore propose an assessment frameworkWe therefore propose an assessment framework While the term “equity” could be understood to encompass a broader set of issues – including non-price criteria (community benefits, diversity, restoration…) in tender design – we concentrate in this paper on funding and disbursement mechanisms. (Figure 12) for good CfD design that takes into account the front end of the CfD design, investors and markets on one side, and the back end, consumers on the other side, to guide policy-makers towards good CfD design. We examine the consumers’ side in section 4.2 below, and the investors’ and markets’ side in Part 2 of the CfD series.
Figure 12. Assessment framework for good CfD design

Source: RAP figure.
We recommend the European Commission issues a clear guidance document for two-sided CfDs, in accordance with established practices, spelling out principles that guide policy makers to smarter CfDs:
- Ensuring market efficiency, by promoting design that decouples payments from own dispatch (explored in Part 2).
- Ensuring equitable and efficient distribution of burden and surplus for consumers.
In order to entice Member States to follow the guidelines the commission could consider proposing a simplified state aid approval process for compliant designs. As state aid procedures are usually time and resource-consuming, such an incentive could be effective in stimulating adherence to the guidelines and would drive harmonisation between Member States which would benefit investors and markets.
4.2 The back-end of a two-sided CfD — consumers
An important design choice for a CfD is the consumers’ side, given they are the ultimate funders or beneficiaries of the instrument. It is perhaps even more important for CfDs than for other types of support schemes, since a CfD is the only scheme that can disburse funds to consumers, not just collect funds from consumers.
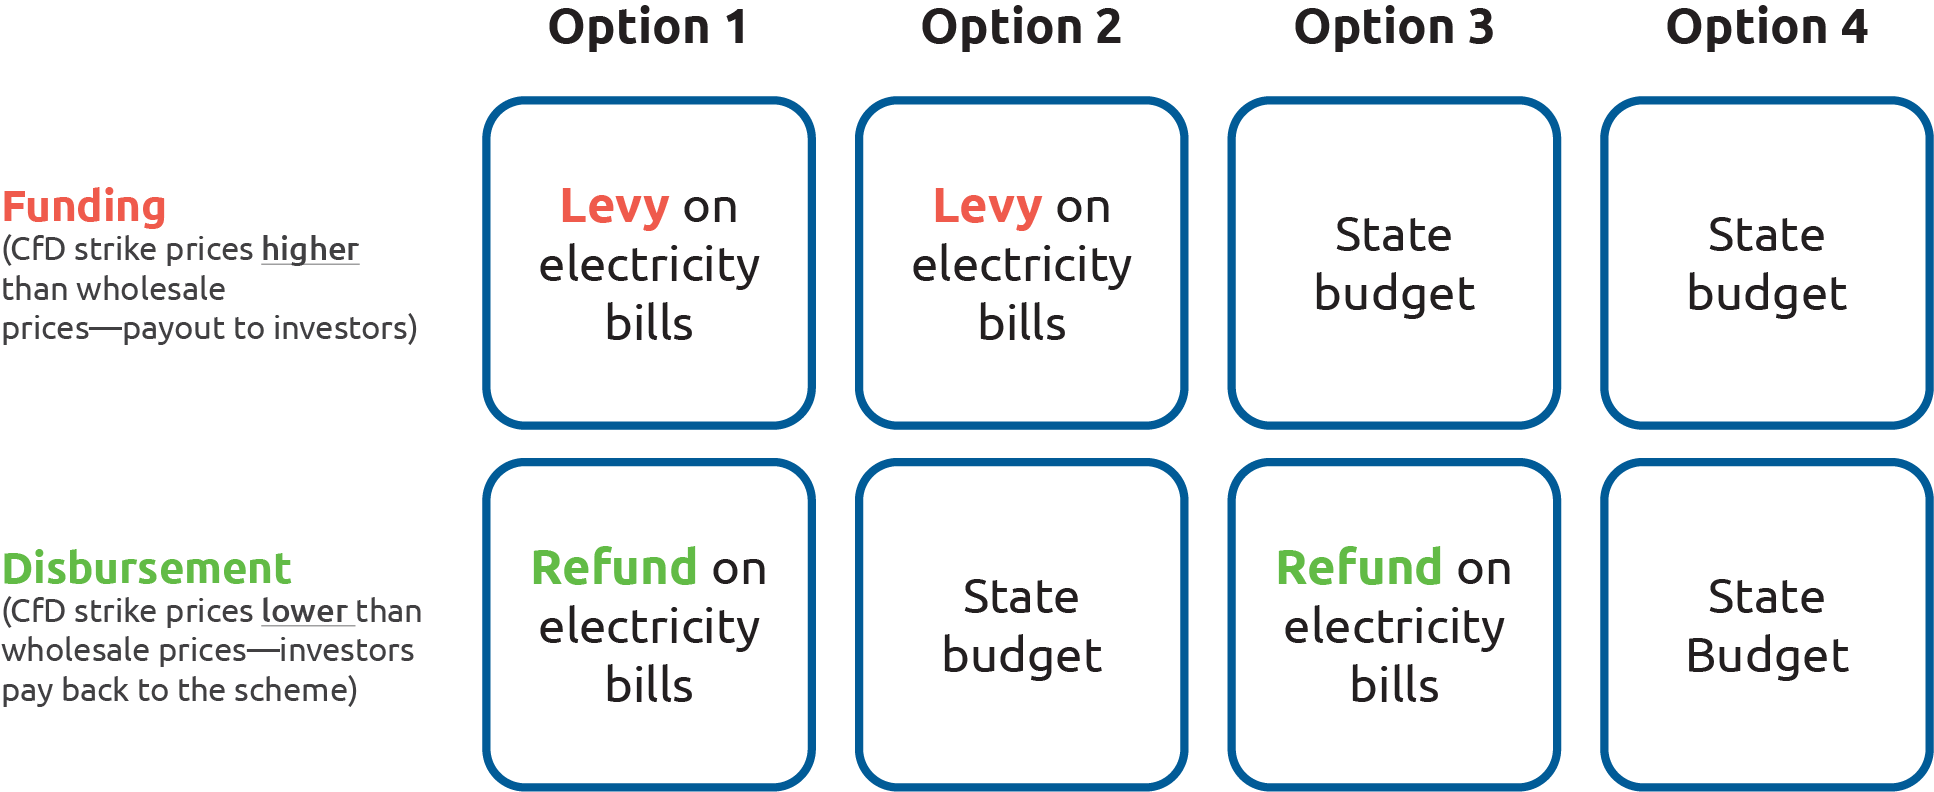
There are two broad sources of funding for CfD schemes, and correspondingly, two ways to channel the surplus back – consumer bills or the state budget. In theory, these do not need to go hand in hand on both sides of the funding-disbursement equation, as we illustrate in Figure 13 below.
Figure 13. Options for funding-disbursement mechanism for two-sided CfDs
Source: RAP figure.
Most European countries use a levy on consumer bills to fund their RES support schemes, albeit with many exemptions, the most popular being for energy intensive industriesthe most popular being for energy intensive industries Of course, such a widespread exemption puts more burden on other consumers. In Germany RES levy at its highest level reached almost 70 EUR/MWh[1], which arguably prompted German government’s decision to take the RES levy from the consumers’ bills and fund it instead from federal budget from July 2022.. It is relatively rare to fund these schemes financed via general taxation. Only five Member States used this option in 2019 – Denmark, Luxembourg, Malta, Romania, France – and, more recently, Germany. The following box displays the main types of exemptions from RES levies and the main variations in budget funding.
| RES levy | State budget |
|---|---|
Exemptions for:
| Variations:
|
Funding and disbursement design should support equity and efficiency both in collection of funds (when reference prices are below strike prices) and in distribution of proceeds (when reference prices exceed strike prices). In particular the mechanisms should take into account the need to:
- Preserve incentives for energy efficiency and demand side flexibility (DSF) both over the long-term and during shorter yet sustained episodes of high prices
- Promote public support for renewables
- Support equity, allowing for targeted assistance to priority groups such as low-income and vulnerable consumers
On balance, we consider that securing public support for the energy transition is of utmost importance, and this calls for making the effect of CfDs in reducing bills during periods of high prices as visible as possible. This is likely best achieved by disbursing it through electricity bills in a visible manner, rather than the state budget.
If refunds are indeed channeled through bills, the case for conducting funding through a levy on bills is strengthened, as symmetry in funding and disbursement mechanisms supports long-run cost reflectivity in electricity bills, which sends appropriate signals for energy efficiency investments.
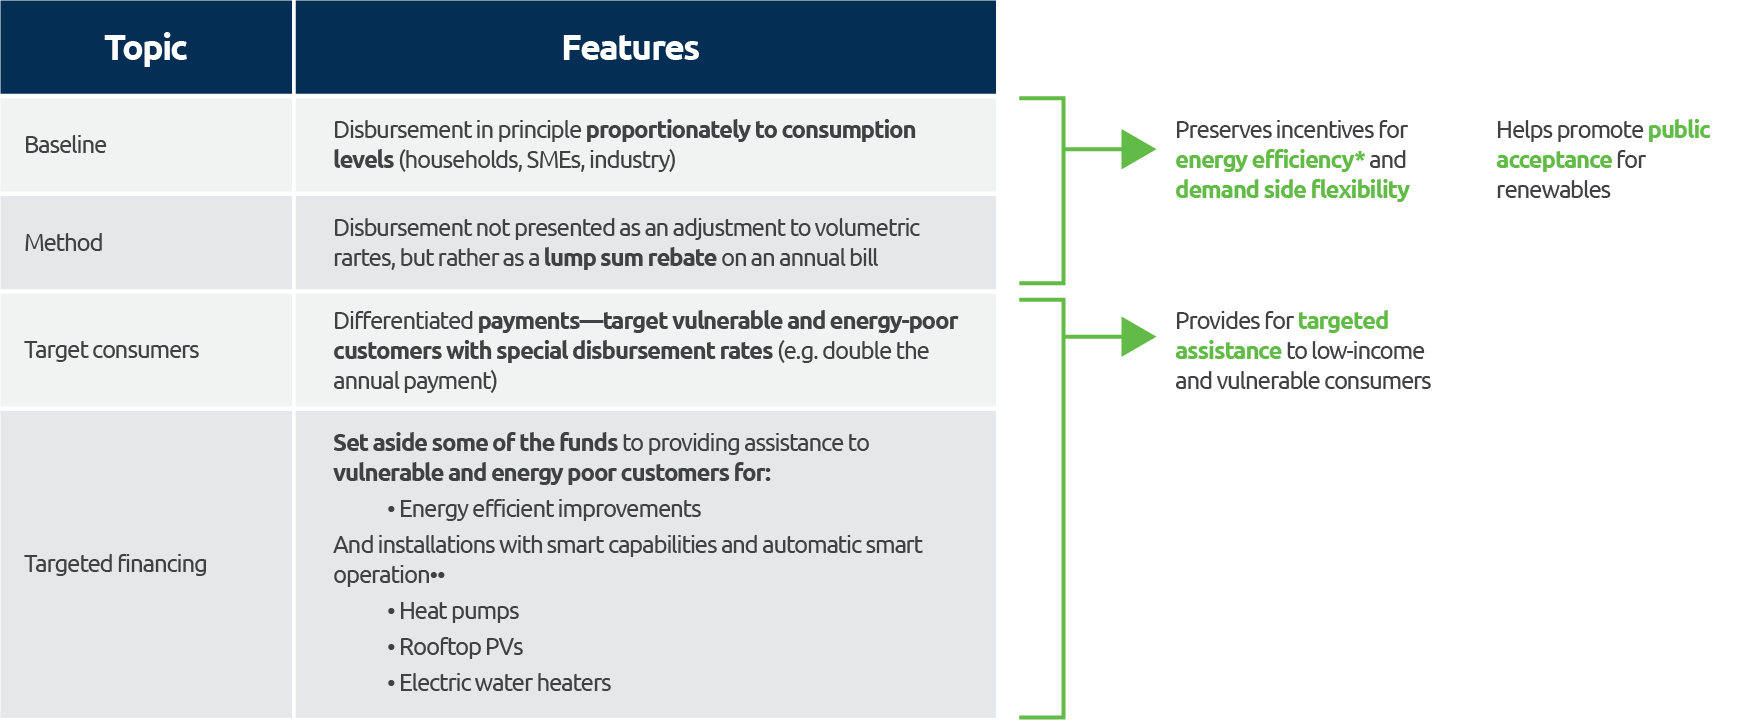
While these refunds should help consumers to weather sustained periods of high prices, at the same time they should ideally not dampen incentives to adjust their consumption during these moments. The table below builds on these observations to outline design features of a promising disbursement mechanism through electricity bills.
Figure 14. Potential disbursement design
* Here we are guided by cost reflectivity, which helps to send the right signals for energy efficiency and DSF.
**To ensure flexibility without the need to expose vulnerable and energy poor customers to dynamic tariffs risks
Source: RAP figure.
In relation to the proposal by the European Commission to disburse funds proportionately to consumption, we recommend that these be presented as lump-sum disbursements, with payments tailored in size by groupwith payments tailored in size by group It could also be considered to exclude large consumers from the disbursement scheme, and in this way to incentivise them to invest in their own RES generation or sign corporate PPAs with RES developers. (households, SMEs, industry). This could take the form of a rebate on an end-of-year electricity bill (or a refund directly on a customer’s account). Presenting the disbursement as a per-MWh discount on a regular rate would be barely visible for the consumer, whereas letting the funds accrue over the year shows the benefits of cheap renewable energy and thus promotes public acceptance for renewables. The additional merit of an occasional lump sum payment is that it may limit undesirable changes in behaviour, such as resisting reducing consumption in the short-run during high price periods.
It may be prudent however not to disburse all proceeds, particularly during sustained periods of high prices. In particular, providing low-income and vulnerable consumers with higher relief relative to other types of consumers (e.g. by applying a correction factor on their allocation) can help in pursuit of wider equity goals. This can be complemented by setting aside part of the funds available towards targeted support for the vulnerable for investments in energy efficiency and smart electrification and thus further shielding them from high energy prices.
The relationship between CfDs and consumers merits further work, with potentially new innovative ideas emerging, whereas it will continue to be important to ensure low income and vulnerable consumers are offered special consideration. The starting point will be the decision on which portion of the electricity bill the disbursement should be directed at: it could be the network portion, taxes and levies (one could envisage a “positive” levy, where a consumer would see a RES rebate instead of RES levy) or the retail portion. The latter is particularly promising for countries with robust retail competition, and could underpin incentives for retailers to offer consumers two-part tariffs, one linked to their actual consumption of renewables covered by CfDs which may be linked to the CfD strike price, and the other, the remainder of their consumption, linked to variable wholesale prices (or fixed for the consumer with the retailer incorporating in a premium to cover risk). Such an approach should support efficient outcomes.
Annex 1
Main two-sided CfD design elements in 12 countries (11 Member States + UK)
| Design feature / Country | Duration | Technology focus | Award criteria | Strike price indexation | Reference price averaging period | No payout when prices negative | Funding |
|---|---|---|---|---|---|---|---|
| 🇧🇪 Belgium | 20 | Offshore wind | Multi-criteria, 10% for innovatiion in business model | Yes, annually, 30%, related to O&M portion | Monthly “Available Active Power” plus max annual payout | NA | Excise duties on electricity |
| 🇩🇰 Denmark | 20 | Multi-tech1 / project specific2 | Price | No | Annual average spot price in the preceding year / hourly day ahead spot price | No support at zero or negative prices | State budget |
| 🇫🇷 France | 20 | Multi-tech / tech-specific / project-specific2 | Price / multi-criteria | Yes, technology-specific formula incl. PPI and wages growth | Monthly average technology-specific capture prices3 | No support at negative prices | Fossil fuel taxes |
| 🇬🇷 Greece | 20 | Multi-tech / tech-specific | Price | No | Monthly average technology-specific capture prices | Zero or negative for more than 2 consecutive hours | RES levy |
| 🇭🇺 Hungary | 15 | Multi-tech | Price | Yes, CPI–1% | Monthly average technology-specific capture price3 | Zero or negative for more than 6 consecutive hours | RES levy |
| 🇮🇪 Ireland | 15 | Multi-tech | Price | No | Hourly day ahead spot price (under review) | No support at negative prices | PSO (public service obligation) levy |
| 🇮🇹 Italy | 20 – 304 | Multi-tech / Tech-specific | Price / multi-criteria | No | Hourly day ahead zonal price | Zero or negative for more than 6 consecutive hours | RES levy |
| 🇵🇱 Poland | 15 / 255 | Multi-tech / Tech-specific | Price | Yes, CPI | Day ahead average spot price / imbalance price / hourly spot price4 | No support at negative prices | RES levy |
| 🇵🇹 Portugal6 | 15 | Tech-specific | Price | Yes7 | Forecasted technology-specific capture price | Zero or negative for 6 consecutive hours | RES levy |
| 🇷🇴 Romania | 15 | Tech-specific | Price | Yes, Eurozone CPI | Monthly technology-specific weighted average of the day ahead market price | No support at negative prices | RES levy |
| 🇪🇸 Spain | 12 | Multi-tech | Price | No | Hourly day-ahead spot price with a 5% adjustment factor (source) | Zero or negative for 6 consecutive hours | RES levy / state budget |
| 🇬🇧 UK | 15 | Multi-tech | Price | Yes, CPI | Hourly day-ahead spot price | No support at negative prices9 | Levy on suppliers8 |
1 Scheme introduced in 2021. The first auction conducted so far under the scheme in 2021 was unsuccessful, received no bids.
2 Separate auctions for specific offshore wind projects; support provided for 50,000 full load hours
3 Monthly average of day ahead spot prices (without negative values) weighted by actual total volume of generation of each technology
4 Depending on technology
5 Separate support scheme for offshore wind with 25-year contract duration
6 Special case – tenders for grid connection capacity
7 Indexation introduced in 2022 for projects awarded between 2019-2021
8 UK is using a special instrument whereas the levy is calculated for and paid by the suppliers, which then recoup it from consumers (and in case of surplus are obliged to disburse it).
9 This has evolved. At first (from the start of the scheme in 2014) there was no rule on negative prices. Then from 2017 auctions the ”6 hour rule” was established, and since Allocation Round 4 in 2022 there is no payout from the first hour of negative prices.
Sources: AURES II project, EC’s state aid decisions, webpages of energy regulatory offices and government departments.
References
In order of descending dates:
Adriaen, D. (2023, June). Offshorewindparken betalen dit jaar 190 miljoen euro terug aan staatskas. De Tijd.
International Energy Agency. (2023, June). Will solar PV and wind costs finally begin to fall again in 2023 and 2024?
European Commission. (2023, June). Report from the Commission to the European Parliament and the Council on the review of emergency interventions to address high energy prices in accordance with Council Regulation (EU) 2022/1854. COM(2023) 302 final.
Blyth W. Gross R., Jansen M., Nash, S., Rickman, J., Maciver, C., & Bell, K. (2023, April). Transition Risk: Investment signals in a decarbonising electricity system. UK Energy Research Centre.
Radowitz, B. (2023, 26 April). ‘Princess Elisabeth zone’ | Belgium opts for CfDs in gigascale offshore wind expansion. Recharge.
Florence School of Regulation. (2023, 5 April). The role and design of contracts for difference for a future-proof electricity market design [Presentation].
Council of European Energy Regulators. (2023, March). CEER report on tendering procedures for renewable energy sources in Europe.
European Commission. (2023, March). Proposal for a Regulation of the European Parliament and of the Council amending Regulations (EU) 2019/943 and (EU) 2019/942 as well as Directives (EU) 2018/2001 and (EU) 2019/944 to improve the Union’s electricity market design. COM/2023/148 final.
Rosslowe, C. (2023, March). Wind and solar deployment in the EU. Ember.
Franke, A. (2023, 2 March). INTERVIEW: European PPA market could see record deals in 2023: Pexapark. S&P Global Commodity Insights (spglobal.com)
Jones, D. (2023, January). European electricity review 2023. Ember.
International Renewable Energy Agency. (2023). The cost of financing for renewable power.
Pexapark. (2023). European PPA market outlook 2023.
Newbery, D. (2023). Efficient renewable electricity support: Designing an incentive-compatible support scheme. Energy Journal. International Association for Energy Economics.
ERSE. (2022, December). Tarifas e Preços para a Energia Elétrica em 2023.
International Energy Agency. (2022, December). Is the European Union on track to meet its REPowerEU goals?
Schlecht, I., Hirth, L., & Maurer, C. (2022, December). Financial wind CfDs. ZBW, Leibniz Information Centre for Economics, Kiel, Hamburg.
Urzad Regulacji Energetyki. (2022, December). Aukcje OZE 2022: Prezes URE podsumowuje wyniki aukcji na sprezedaz energii elektrycznej ze zródel odnawialnych [Renewable energy auctions 2022: The president of the Energy Regulatory Office summarizes the results of the auction for the sale of electricity from renewable sources]. Energy Regulatory Office, Poland.
European Commission. (2022, November). Report from the Commission to the European Parliament and the Council on the performance of support for electricity from renewable sources granted by means of tendering procedures in the Union. COM(2022) 638 final.
Molina, P. S. (2022, 24 November). Zero solar allocated in unsuccessful 3.3 GW renewables auction in Spain. PV Magazine.
Urząd Regulacji Energetyki. (2022, November). Odnawialne źródła energii: zerowa stawka opłaty OZE w 2023 roku.
Neuhoff, K., May, N., & Richstein, J. C., (2022, November). Financing renewables in the age of falling technology costs. Resource and Energy Economics, 70, 101330.
Green Power Denmark. (2022, October). Forventet havvindmøllestøtte i 2022 og frem.
Santos, B. (2022, 22 October). Portugal offers remuneration boost to solar auction winners. PV Magazine.
European Commission. (2022, September). Energy prices: Commission proposes emergency market intervention to reduce bills for Europeans.
Tsagas, I. (2022, 13 September). Greece’s renewables tender awards 372 MW of PV at average of €47.98/MWh. PV Magazine.
RE-Source. (2022, August 29). Revisions of the regulation on Guarantees of Origin to foster the renewable energy market [Letter].
Commission de Régulation de l’Énergie, France. (2022, August). CRE consults market players on changes to future gas transmission and storage infrastructure tariffs for the period 2024-2027.
Fox, H. (2022, July). Ready set go, Europe’s race for wind and solar. Ember.
European Commission. (2022a, May). Communication from the Commission to the European Parliament, the European Council, the Council, the European Economic and Social Committee and the Committee of the Regions REPowerEU Plan. COM/2022/230 final.
European Commission. (2022b, May). Commission Staff Working Document: Implementing the RepowerEu Action Plan; investment needs, hydrogen accelerator and achieving the bio-methane targets. SWD(2022) 230 final.
Hogan, M., Claeys, B., Pató, Z., Scott, D., Yule-Bennett, S., & Morawieka, M. (2022, April). Price shock absorber: Temporary electricity price relief during times of gas market crisis. Regulatory Assistance Project.
European Commission. (2021, November). State aid SA.60064 (2021/N) — Greece: Greek RES and heCHP scheme 2021-2025. C(2021) 8651 final.
Diallo, A., Dézsi, B., Bartek-Lesi, M., Szabó, L., & Mezősi, A. (2021, October). Auctions for the support of renewable energy in Italy. AURES II.
European Commission. (2021, July). Aide d’État SA.50272 (2021/N) — France: Appels d’offres pour les renouvelables 2021-2026. C(2021) 5453 final.
Winkler, J. (2021, July). The state of multitechnology auctions in Europe. AURES II.
Council of European Energy Regulators. (2021, June). Status review of renewable support schemes in Europe for 2018 and 2019.
European Commission. (2021, May). State Aid SA.56831 (2021/N) — Denmark: Multi-technology RES tenders 2021-2024. C(2021) 3273 final.
Department for Business, Energy and Industrial Strategy. (2021, March). Evaluation of the Contracts for Difference Scheme: Phase 3, Final Report. Technopolis Ltd and LCP Ltd. UK government.
European Commission. (2021, March). State Aid SA.57858 (2021/N) — Denmark — Thor Offshore wind farm. C(2021) 1447 final.
Danish Energy Agency. (2020, July). Guidance on the hybrid CfD and award criterion.
European Commission. (2020, July). State Aid SA.54683 (2020/N) — Ireland: Renewable Electricity Support Scheme (RESS). C(2020) 4795 final.
Jansen, M., Staffell, I., Kitzing, L., Quoilin, S., Wiggelinkhuizen, E., Bulder, B., Riepin, I., & Müsgens, F. (2020, July). Offshore wind competitiveness in mature markets without subsidy. Nature Energy, 5, 614–622.
Egli, F. (2020, May). Renewable energy investment risk: An investigation of changes over time and the underlying drivers. Energy Policy, 140, 111428.
Energiewende Direckt. (2020, March). Was ist eigentlich der Energie- und Klimafonds?
Rio, P.-d., Lucas, H., Dézsli, B., & Diallo, A. (2019, December). Auctions for the support of renewable energy in Portugal. AURES II.
European Commission. (2019, June). State Aid SA.53347 (2019/N) — Italy — Support to electricity from renewable sources 2019-2021. C(2019) 4498 final.
Neuhoff, K., May, N., & Richstein, J. C., (2018, July). Renewable Energy Policy in the Age of Falling Technology Costs. DIW Berlin Discussion Paper No. 1746.
Jégard, M., Banja, M., Dallemand, J.-F., Motola, V., Sikkema, R., Taylor, N., & Monforti-Ferrario, F. (2017). Renewables in the EU: An overview of support schemes and measures. European Commission, Joint Research Centre, Publications Office.
European Commission. (2017, November). State aid SA.40348 (2015/NN) — Spain: Support for electricity generation from renewable energy sources, cogeneration and waste. C(2017) 7384 final.
European Commission. (2016, May). State Aid SA.41694 (2015/N) — Portugal: Support to renewable electricity in Portugal. C(2016)2874 final.
European Commission. (2014). Communication from the Commission — Guidelines on state aid for environmental protection and energy 2014-2020. (2014/C 200/01).
European Commission. (2013, November). Commission Staff Working Document: European Commission guidance for the design of renewables support schemes. SWD(2013) 439 final.
Low Carbon Contracts Company. (n.d.). Scheme Dashboards.
The authors would like to thank Bram Claeys, Richard Lowes, Zsuzsanna Pató, and Louise Sunderland for comments on various drafts, and Tim Simard for editorial and technical assistance. Many thanks also to Lena Kitzing and Fabian Wagner for comments on an early draft. All errors are the authors’ own.
- Published:
- Last modified: June 18, 2025


 Quick guide on how to use this website: