


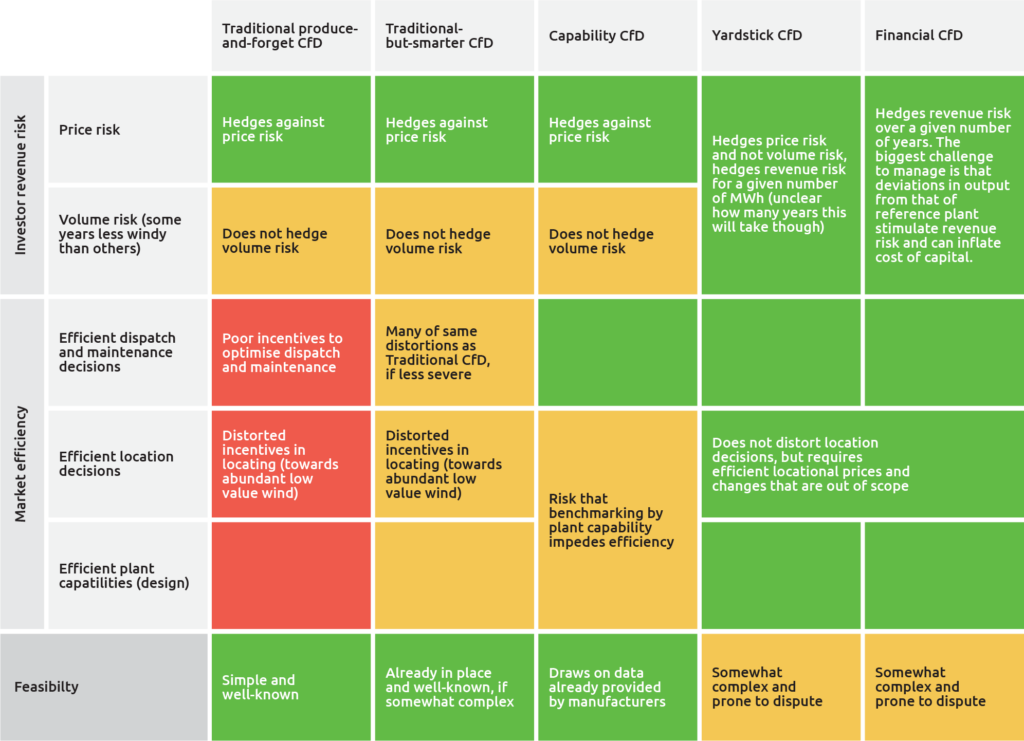
Fair enough. But the purpose of this paper is to judge the different types of two-sided CfDs, and thus we apply the following assessment criteria: first, market efficiency; second, investor risk — in particular revenue (un)certainty; and third, feasibility. We go through each of these below.
Market efficiency requires that the CfD regime does not interfere with the role of spot prices in signaling the value of energy. This supports efficiency in dispatch, maintenance scheduling and investment decisions in terms of capability and location (in turn dependent on efficiency of spot price formation). Market efficiency will become increasingly important as renewables penetrations grow.
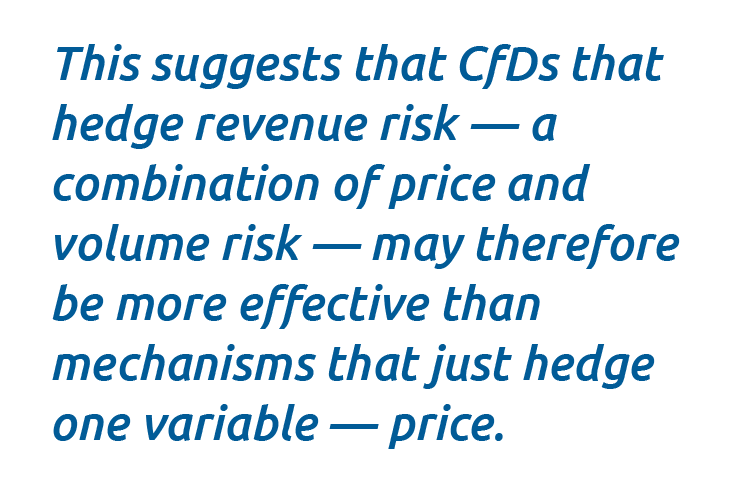 A reduction in investor revenue risk over the lifetime of a plant lowers the cost of capital and, all else equal, lowers costs of the energy system for consumers. Revenue risk depends not only on potential price distributions but also energy output and their interactions. Wind output for example tends to fluctuate year by year. High wind years tend to be associated with lower capture prices, while low wind years tend to be associated with higher capture prices. As wind penetration grows, this natural counterbalancing effect on revenues can be expected to grow and help limit investor revenue risk for merchant plants (i.e., without availing of a support mechanism like a CfD) between years. For this reason, our investor risk criterion encompasses both price risk and volume riskprice risk and volume risk And for volume risk it focuses on the risk that is out of control of the plant, most notably whether it is a low or high wind year, rather than whether the plant owner selects and optimal location and makes the most of the plant’s capabilities, which is largely under their control..
Finally, the feasibility criterion considers simplicity, transparency and potential implementation challenges. This criterion allows our analysis to shed light on trade-offs inherent in more efficient designstrade-offs inherent in more efficient designs These criteria link with those presented in Balancing act. Two-sided contracts for difference for a speedy, cost-efficient and equitable energy transition., which tend to introduce more complexity.
Notable criteria out of scope of this paper are efficiency and equity in financing and disbursement, which we consider in the accompanying Blueprint deep dive on CfDs.
To ease comparison, we assume CfD designs are of the same duration and all other main contract elements — such as indexation, exit options — are equivalent. We concentrate on design features that have a direct impact on how a given renewable energy sources (RES) plant behaves in the electricity market.

Figure 1. Schematic representation of a Traditional “produce-and-forget” CfD
Source: RAP figure
Market efficiency
The quite substantial drawback of this CfD is that the incentives guiding operational and investment decisions no longer align with system efficiency. The plant has no incentive to produce more at high price hours and less at low price hours. In extreme situations, the generator is incentivised to produce even when the market is in surplus and prices fall below zero — requiring further price reductions down to the negative value of the CfD to stimulate efficient curtailmentstimulate efficient curtailment For this reason, the European Commission’s state aid guidelines published in February 2022 required that beneficiaries of support schemes “should not be incentivised to offer their output below their marginal costs and must not receive aid for production in any periods in which the market value of that production is negative.. Overall, the Traditional CfD motivates dispatch decisions and investment decisions that maximise total energy output over contract lifetime, rather than decisions that maximise system value as guided by wholesale prices. As such the Traditional CfD encourages locating in the windiest sites even when other sites would provide greater system value (owing for instance to a lower correlation with the rest of the wind fleet), and dispatching even when the system calls for curtailmentcurtailment The reduction of power output of specific generators by the system operator on grounds of maintaining grid stability and system safety, often in exchange for compensation. and stimulates negative prices. This inflates system cost, and recognition of this has stimulated the search for a design that could deliver positive effects without these market distortions.Investor risk
This CfD fully shields the plant from wholesale price variability as it always receives the strike price on metered electricity produced.Feasibility
The design is relatively simple and easy for investors to understand and has proven its feasibility in practical application across multiple Member States.Summary
Recognition of inefficiencies in this simple CfD design quickly ignited the search for a design that could deliver positive effects without market distortions.
Our stylisation of a Traditional-but-Smarter CfD has additional features:
- Rather than use, say, half hourly wholesale prices to compare with strike prices and calculate the positive or negative difference payment for each half hour, the reference price is formed of an average of wholesale prices over a longer period — daily, monthly or annual.
- There is no payout when spot prices turn negative.
Figure 2 illustrates this CfD.
Market efficiency
First, we consider the impact of longer reference price periods. The left-hand graphic shows for each subset of averaged time periods the difference between the spot price and reference price. These differences are added or subtracted from the CfD strike price to shape final (net) capture prices, shown in the right-hand graphic. Comparing net capture prices of this Traditional-but-Smarter CfD with the Traditional produce-and-forget CfD — in other words, comparing the extremities of the solid yellow area with the orange line in the right-hand graphic — illustrates the variability in net capture price introduced by “smartening” the CfD.
Figure 2 shows two moments (1) and (2) where a plant chooses to curtail as a result of the negative spot prices no-payout rule. When wholesale prices drop below zero, as illustrated in moment (1), there is no (green) payout, and thus the plant will choose to curtail during these moments. The plant will also elect to curtail when wholesale prices turn negative, while a positive reference price exceeds the CfD strike price, as illustrated in moment (2): in this scenario the plant would have to make a difference payment to the government as well as pay to be dispatched on the wholesale market. In this way, ‘smartening’ the Traditional CfD supports efficient self-curtailment incentives.
Figure 2. Schematic representation of a Traditional-but-Smarter CfD
1. With negative price no payout rule, net capture price turns negative, and so plant chooses not to dispatch
2. Negative price no payout rule not in effect, but net capture price is negative, and so plant chooses not to dispatch
Source: RAP graphic
The use of reference prices formed through averaging of wholesale prices over given time periods at first sight has the appeal of focusing the attention of the plant owner, within any given averaging time frame, on the subset of hours when prices are highest and when energy has the highest value and away from lower price periods. Unfortunately, this fix leaves the absolute reward for dispatch and the opportunity cost of non-dispatch still divorced from true system value — the hourly wholesale price. For example, in the very first period illustrated above, the final capture price is zero and a wind plant might choose to go offline for maintenance in that hour, even though the high wholesale price of 60 Eur/MWh points to significant value to the system of its energy. The decision of when to schedule maintenance is still subject to distortion: the ‘fix’ also leaves the system in a fix.
Furthermore, adding a no-payout rule when spot prices dip below zero helps limit inefficiency for a zero marginal cost plant like solar PV. But it may nevertheless prove increasingly unsatisfactory over time. Some analyses suggest, for example, that a wind plant has variable running costs (and thus presumably marginal costs) that are appreciably above zero, for instance as much as €5/MWh to €10/MWh. Thus, as more wind is added to the system and it increasingly sets prices, a zero-price no-payout rule may stimulate a greater incidence of zero prices — to motivate curtailment — than efficient given prices close to €5/MWh to €10/MWh might suffice. Getting this right is important for cost recovery through market prices for all plants, including for other technologies, and is thus central for an efficient capacity mix.
Investor risk and feasibility
While the feasibility of this CfD design is not radically different from the Traditional CfD, the investor risk is likely to be higher, in turn requiring a higher strike price.
Summary
At the end of Act 2 in this overview of the search for an efficient two-sided CfD, we find that our fixes have their own flaws — the leopard has not changed its spots — and thus the journey continues for a better solution.

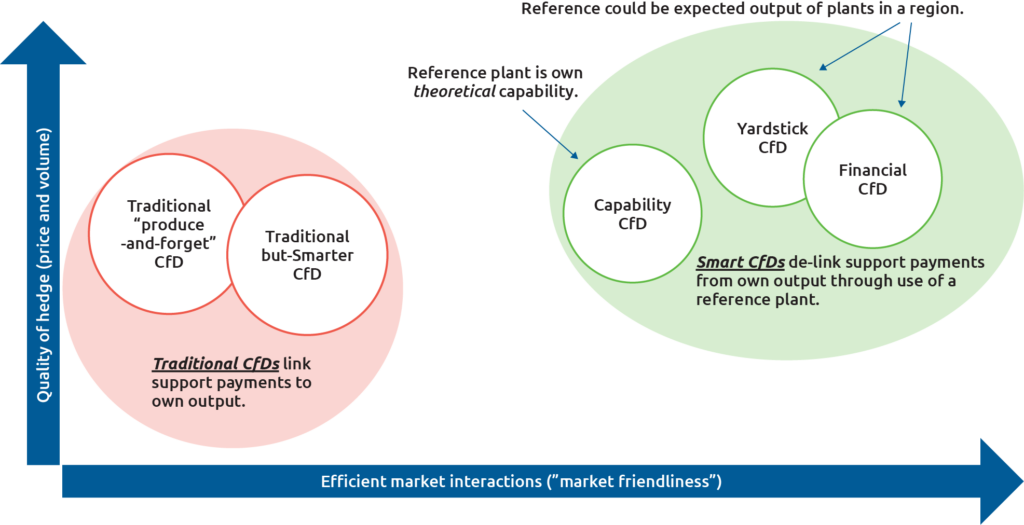
This section presents new innovative designs that are yet to be widely promulgated. They each have their own specific features, but a key design innovation they share is that payment is decoupled from actual production. Although some of these were originally developed specifically for wind resources, they might be applied to other technologies like solar PV with modifications.
Scene 1: Capability-based CfD
Belgian System Operator Elia shared a draftBelgian System Operator Elia shared a draft This was from an as-of-yet unpublished Elia Group report called: Sustainable 2-sided Contract for Difference design and models for combination with Power Purchasing Agreement, Two part explanatory note. of a new Capability-based CfD that decouples difference payments from plant dispatch through use of a reference plant. This CfD decouples difference payments from actual output by calculating the theoretical output capability of a plant for given environmental (wind, sun) conditions, guided by manufacturer specifications.
Market efficiency
The left-hand chart within Figure 3 shows the net revenues (in dark grey) pocketed for a given hour by a plant that delivers the same energy output (indicated on the horizontal axis) as its theoretical capability when spot prices exceed strike prices (low wind output scenario), and the plant pays the excess above strike price to the government (in yellow). The left-hand chart within Figure 4 shows net revenues pocketed (dark-grey plus light-grey areas) when the strike price exceeds spot price, and the government tops up spot price revenues to the strike price.
In both cases, the plant revenue sums up to the spot price multiplied by the simulated output capability. To explore whether this provides a solid foundation for market efficiency, we consider what happens if actual dispatch diverges from theoretical capability and what this tells us about efficient incentive formation.
To shed light on the market friendliness of the design, the middle and right-hand schematics in Figure 3 explore the change in revenue as output deviates from capability, under a scenario where spot prices exceed strike prices. This shows that by underperforming, the plant makes losses on the deficient volumes of output, and these losses are valued at the spot price (area A plus B). If the plant can overperform — noting this may be rather difficult in the case of this CfD, given that capability assessment is bespoke to each plant — it pockets additional revenues on the excess energy supply valued at the spot price (area C plus D). This sets efficient incentives for dispatch. The Capability-based CfD is therefore a significant improvement over the Traditional CfD. It is also an improvement over the Traditional-but-Smarter CfD which divorces the absolute reward for dispatch and the opportunity cost of non-dispatch from true system value.
Figure 3. Capability-based CfD — spot price exceeds strike price scenario
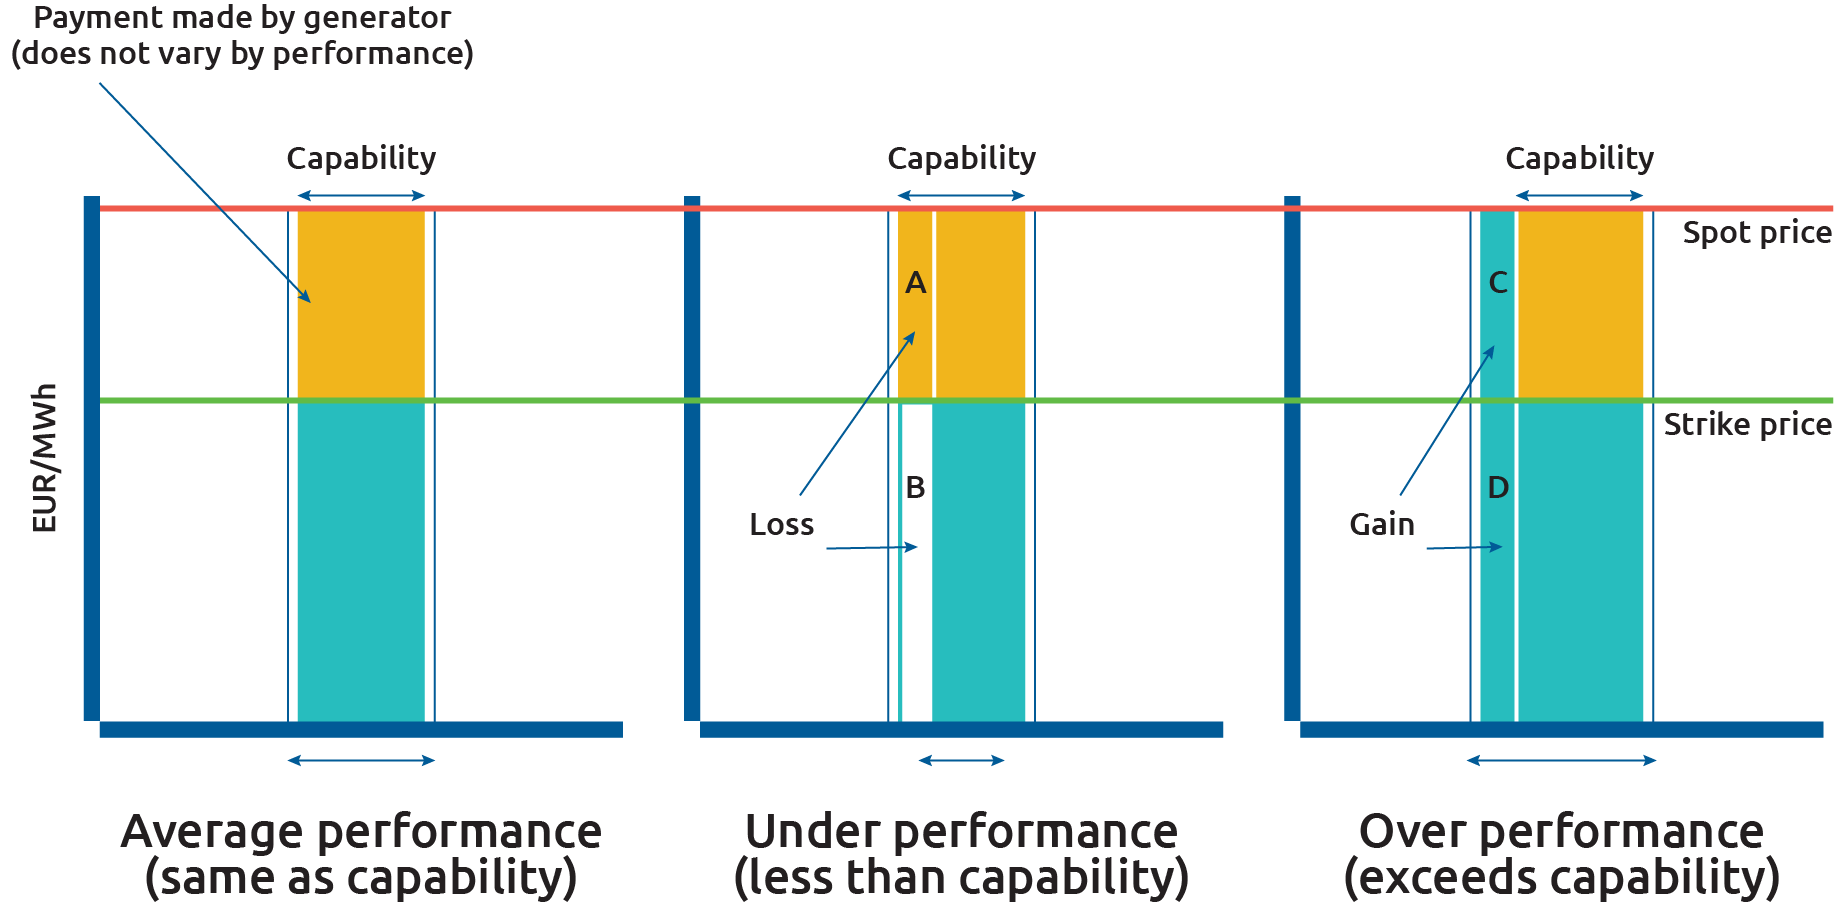
Source: RAP graphic
Figure 4 shows — for the alternative scenario of a spot price below the strike price (high wind scenario) — that the reward for (or cost of) under-performing or over-performing is determined by the spot price, again supporting efficient dispatch. By underperforming, the plant makes losses on the deficient volumes of output, and these losses are valued at the spot price (area A). If the plant can overperform — with the same caveat as before — it pockets additional revenues on the excess energy supply valued at the spot price (area B).
Figure 4. Capability-based CfD — strike price exceeds spot price scenario

Source: RAP graphic
By ensuring non-interference with the spot price the Capability-based CfD provides efficient dispatch incentives. As such, it underpins an incentive for a plant not to dispatch when prices fall below marginal cost — whether marginally positive or effectively zero — as support is not linked to whether the plant chooses to dispatch or not. It supports efficient maintenance scheduling for moments when the system value of additional wind is lowest.
To ensure smart regulation, it is prudent to consider whether the Capability-based CfD would inadvertently give a plant the incentive and ability to misstate its capability and the likely impacts of this hypothetical scenario. We conclude that a plant might have some incentive to understate its capability, but it is not clear it would be able to act on it or that this should be a significant concern.
A limitation, however, of the Capability-based CfD is that using a reference capability that is bespoke to each plant may not support investment in the optimal mix of plants by location and capability. For example, an investor might be indifferent between two locations that offer the same wind yield over a year, but where the profile of one has higher system value than the other.
Investor risk
The Capability-based CfD limits price risk: the average plant will pocket the strike price on its output. It does not address volume risk beyond the control of the plant — that some years are windier than others. Thus, although it fixes price, the energy volumes this applies to will vary by year according to whether it is a relatively windy or still year. This matters because windy years are typically associated with lower prices, and still years with higher prices, which tends to stabilise wind revenues. By fixing price but not volumes, the revenue stabilising effect of the Capability-based CfD may be somewhat limited. This critique, which applies also to most CfDs, means that there may be room for design innovations to stimulate further cost of capital reductions.
Feasibility
The Capability-based CfD design appears to be quite feasible; the module and data underpinning it already exist.
Conclusion
In sum, the Capability-based CfD is an improvement on traditional designs, in that it supports efficient dispatch and maintenance scheduling. Nevertheless, there is room for improvement to enhance hedginghedging Transactions entered into by investors and other market participants that protect them against specific risks they anticipate in carrying out their business in the future. A hedging counterparty is the entity with whom a market participant transacts, who undertakes some or all of the subject risk. cover and ensuring efficient plant investment decisions, such as by location.
Scene 2: Yardstick CfD
The Yardstick CfD (a model proposed by Professor Newbery), is a CfD with hourly contracted volume proportional to forecast local output per unit of capacity (by technology). Thus, forecast local output in a geographic area is the yardstick or reference that divorces payments from actual production.
Successful auction participants will be paid each period the product of — forecast output of local plant of the given technology — and the difference between strike price and spot price. Day-ahead prices are used as the reference spot price; with locational marginal pricing, real-time spot prices can be used.
Market efficiency
Figure 3 and Figure 4 illustrate the functioning of the Yardstick CfD, where capability is reimagined as a forecast of local output per unit by technology, rather than bespoke to each plant as envisaged in the Capability-based CfD.
The incentive to dispatch is still set by wholesale prices, and this supports efficient dispatch and maintenance signals. Like the Capability-based CfD, it provides an incentive for a plant not to dispatch when prices fall below marginal cost — whether marginally positive or effectively zero — as support is not linked to whether the plant chooses to dispatch or not.
Linking capability to local forecast output, rather than bespoke for each plant according to manufacturer’s specifications, should shape investment incentives that deliver optimal siting by location and mix of capability over time. For example, during periods of high prices, a high performing plant that generates more output than the average reference plant will be able to pocket this value and enjoy a competitive advantage. This addresses a potential concern with the Capability-based CfD, which provides limited scope to outperform the reference plant when prices are high — since the reference is specifically tailored to each individual plant. This also suggests that the larger the area in composing local capability forecasts, the more efficient will be the signals produced by the CfD — the drawback being the quality of the hedge.
Investor risk
As the life of the CfD is specified in full operating hours, such as 30,000 MWh/MW, and not in a fixed number of years, it hedges price risk for a given volume of energy — it does not hedge volume risk of less windy years. It is not clear at the outset how long it will take to generate this energy as this depends on how windy the years are. Thus, the Yardstick CfD should underpin confidence that an adequately performing plant will recover its costs through the support mechanism, with the caveat that the exact time frame of this cost recovery is unclear at outset. Broadly, this should put downward pressure on the cost of capital.
Other factors may act in the opposite direction to lessen the downward pressure on the cost of capital. The first factor is the Yardstick CfD’s use of a regional reference plant, which likely implies greater deviations in production profiles and greater risk compared with the Capability-based CfD, which uses own capability. A second is that should more locational price signals be introduced, the use of regional reference plants (rather than linked with own capability) would stimulate more price and revenue uncertainty linked with these deviations. The investor has some scope to manage the first factor for instance in selection of plant location, informed by transparency on the reference plant. The second might require redefinition in geographical scope of reference plant, potentially signaled up-front.
Feasibility
CfDs that are offered for a specified number of full operating hours have already been implemented successfully, for instance in China. There will be challenges with using local forecast output as a capability benchmark, for instance in removing the effect of distortive support mechanisms on observed output used to calibrate forecasts. These challenges do not appear to be insurmountable, however.
Summary
The Yardstick CfD supports efficient dispatch and location decisions. The Yardstick CfD appears to address a potential weakness of the Capability-based CfD by using a reference that is not bespoke to each plant and thus better supports investment in an optimal capacity mix. The Yardstick CfD also has the innovation that the subsidy is paid not for a given number of years but for a given number of MWh/MW. It ensures revenues are sufficient for an adequately performing plant, though it leaves the investor with some uncertainty about how long this will take.
Scene 3: Financial CfDs
This proposed CfD model, developed by Schlecht et al., is quite different from all the previous designs. It provides for a fixed monthly payment (for, say, 20 years) from the government to the wind farm per standardised 1MW contracted, where the support payment is determined by auction. In return for this constant revenue stream, the generator commits to pay the government hourly revenues, calculated as the product of the energy output of a reference plant(s) valued at the wholesale spot price. The plant finances this through its spot price sales. The regime treats negative prices as zero.
In forming offers into the initial auction, a prospective plant must consider costs and expected deviations in performance compared to the reference plant. A plant that performs exactly as per the reference plant will simply transfer its wholesale revenues to the government, while pocketing the monthly payment determined in the initial auction.
Market efficiency
The left-hand schematic of Figure 5 illustrates the Financial CfD. Green areas are the payments the plant must make to the government, determined as the product of the spot price and the reference plant output (shown with horizontal arrows).
Figure 5. Financial wind CfD
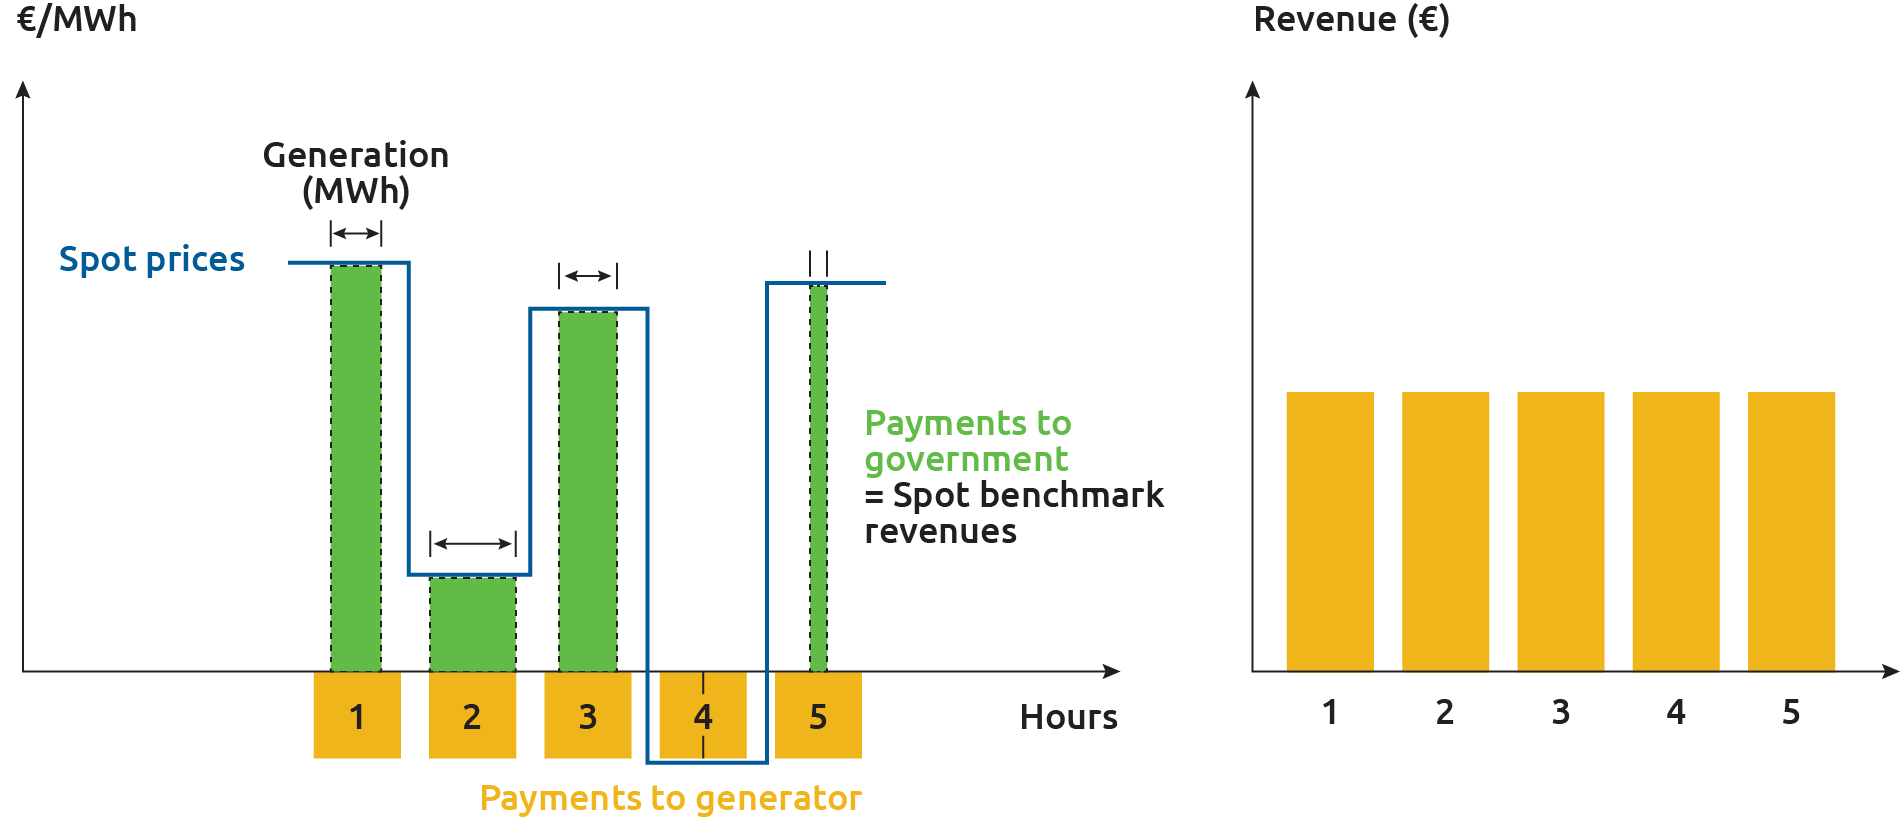
Source: Schlecht, I., Hirth, L., & Maurer, C. (2022). Financial Wind CfDs
If the plant can produce more than the reference plant, then it gets to keep the value of that extra output (on top of the monthly payment it receives — yellow areas under the horizontal axis). Plants that can do this when spot prices are high have a strong competitive advantage. Plants with capability below that of the reference plant are penalised for this lost output at the spot price: they must still make payments to the government according to output of the reference plant, but their spot market sales will not fully finance this. This is particularly costly during high spot price periods. And when spot prices dip below marginal cost (high wind scenario) then the rational strategy is to curtail. This supports efficient dispatch and maintenance decisions. It also means that a high-performing plant with technology, cost or locational advantages will be able to monetise the value it offers to the system from its entry into the market under this CfD design and will be able to make more competitive offers to the CfD auction, thus supporting investment in the optimal mix of capacity over time.
Investor risk
The right-hand schematic of Figure 5 shows the net revenues of a hypothetical plant. In this illustration, output is assumed exactly to match the output of the reference plant; its revenues are the same in every period. For such a plant, this CfD not only hedges price risk, but also hedges volume risk — annual variations in ambient wind — and can help to stabilise revenues and thus reduce further the cost of capital. In terms of stabilising revenues, the Financial CfD thus compares favourably with the CfDs considered previously that fix the price captured per unit sold but that nevertheless, to varying degrees, leave the investor exposed to low wind harvests in some years and high wind in others.
The drawback of the Financial CfD, as with the Yardstick CfD, is that production deviations from the reference plant are likely greater than with the Capability-based CfD and thus may engender a higher cost of capital than the Capability-based CfD (abstracting away other effects outlined above).
Feasibility
The exponents of the Financial CfD suggest that reference plant output could be derived from a mathematical model based on measured, regionally aggregated weather data. This CfD nevertheless enters relatively new territory in that, for the average plant that neither outperforms nor underperforms the reference, the entirety of wholesale revenues are expected to be foregone in return for support payments, elevating further the importance of getting the benchmarking correct. The key battleground is likely to be formation of the output benchmark, and as with other innovative designs, the challenge will be to get stakeholders on board, as the devil in the details becomes apparent.
Summary
The Financial wind CfD hedges price and volume risk and supports efficient dispatch and investment.

 Quick guide on how to use this website: