A RAP Power System Blueprint Case Study
Sweden: Pioneer in incentivising better grid use
Fjolla Fazliu & Zsuzsanna Pató
Grids are unable to connect new users quickly enough and are expensive and timely to build. Sweden pioneered by recognising the need to use existing grids better and by providing financial incentives to distribution system operators (DSOs) to improve grid utilisation. The benefit of this approach is that incentives are linked to the desired outcome, leaving the solutions to the companies that are best suited to pick them.
There is a strong European political consensus on the need for better use of existing grids (European Commission 2025, GridPackage). Several countries have introduced higher network tariffs in peak periods but, so far, only the Swedish regulator (Swedish Energy Markets Inspectorate, Ei) has translated this goal to a revenue incentive for network companies.
The electricity grid in Sweden is divided into three levels: local, regional and transmission, owned and operated by different companies and responsible for transporting electricity over different distances and voltage levels, as seen in Figure 1. The load flow incentive (incitamentet för jämn belastning) is designed to reduce peak power measured at the boundary of gridsmeasured at the boundary of grids The physical connection point between two different electricity grids (i.e., between local and regional DSO and between regional DSO and the TSO). If the grid operator is connected to the upstream grid at several boundary points, the power flows at all boundary points are summed. Source: Energimarknadsinspektionen. (2022). Incitament för kvalitet och effektivt nätutnyttjande i regleringen av elnätsföretagens intäktsramar (Ei PM2022:02). https://ei.se/download/18.1a8c2ef17f44c608409c65/1646811870805/Incitament-f%C3%B6r-kvalitet-och-effektivt-n%C3%A4tutnyttjande-i-regleringen-av-eln%C3%A4tsf%C3%B6retagens-int%C3%A4ktsramar-Ei-PM2022-02.pdf operating at different voltage levels. Reducing peak is key as grid investments are mostly driven by peak capacity needs (MWs) and not by energy transported (MWh).
This case study is part of the RAP power system blueprint deep dive Aligning business models with public interest: Rethinking revenue regulation for network companies. This particular case study examines revenue regulation in Sweden since 2016.
Figure 1. Electricity grid voltage levels and estimated number of operators

Key messages
- Regulators need to incentivise grid operators to make better use of existing infrastructure while still enabling long-term expansion. The load flow incentive is a unique tool used by the Swedish regulator designed to reward DSOs that reduce their highest power flows relative to the upstream grid. It translates social goals (such as lower grid costs for end users) into euros earned by grid operators.
- The load flow incentive in Sweden has been introduced in stages; starting with monitoring, followed by a reward only scheme and turned later into a penalty/reward scheme to reduce the regulatory risk of introducing a new performance target.
- Finding the right metrics for grid utilisation is challenging. Sweden refined the load flow metrics for each regulatory period in the last decade to make sure that it can be controlled to a larger extent by the DSOs (so they can be held accountable for it) and focused it on the critical peak hours that size the grids.
Performance-based incentives in the Swedish revenue regulation
Performance-based incentives are regulatory tools – often integrated into revenue cap regulation – to steer network companies to meet social goals translated into metrics by the regulator. Swedish DSOs and the tranmission system opreators (TSO) have operated under a revenue cap regulation since 2012revenue cap regulation since 2012 The Energy Efficiency Directive 2012/27/EU calls for improving energy efficiency in infrastructure design and operation. The Electricity Directive (2019/944) and Regulation (2019/943) also promote efficiency in grid operation.. The revenue cap is adjusted based on three performance indicators: (i) continuity of supply since 2012 (TSO & DSOs), (ii) network loss since 2016network loss since 2016 Defined as the difference between the amount of energy that is fed into the grid and the amount of energy that is taken out of the grid. Wigenborg, G., Werther Öhling, L., Wallnerström, C.J., Grahn, E., Alvehag, K., Ström, L. & Johansson, T. (2016). Incentive Scheme for Efficient Utilization of Electricity Network in Sweden. Swedish Energy Markets Inspectorate. https://ieeexplore.ieee.org/stamp/stamp.jsp?tp=&arnumber=7521188 (TSO & DSOs), and (iii) grid use measured by the load flow since 2016 (only DSOs).
To limit the revenue risk of grid operators due to these new incentives, the adjustment during the 2016-2019 regulatory period was capped at ± 5% of the revenue cap for all three incentives together. The cap changed to ±33% of the regulated return in the 2020-2023 regulatory periodregulated return in the 2020-2023 regulatory period In average, 33% of the regulated return is about 5 % of the total revenue cap. Wallnerström, C.J., Huang, Y., Wigenborg, G., Ström, L., Johansson, T. (2019). Incentive Scheme for Continuity of Supply in the Swedish Revenue Cap Regulation from 2020, CIRED 2019 Paper No. 0946. Swedish Energy Markets Inspectorate, June 2019. https://ei.se/download/18.4ed2158a18722d7df785b6f/1680684552700/CIRED-2019-Paper-0946-Incentive-Scheme-for-Continuity-of-Supply-in-the-Swedish-Revenue-Cap-Regulation-from-2020.pdf. This joint cap was amended in the current 2024-2027 period with individual caps for each incentive. Before 2020, only the network losses and continuity of supply incentives could result in both rewards and penalties; since 2020 this has applied to all three incentives.
While performance indicators to improve continuity of supply and reduce network losses are widely used in Europe, the grid use incentive is a unique tool used by the Swedish regulator and the focus of the rest of this case study.
Evolution of the load flow incentive
The load flow incentive applies to regional grids (that receive power from the transmission grid and supply local grids or large users) and local grids (that receive power from regional grids and supply end-users). The incentive is designed to promote a more even power flow in the electricity grid relative to the upstream grid. This, in turn, may reduce investment needs in both the grid operator’s own grid and the upstream grid, as well as reduced payments due to the lower required capacity from the upstream grid.
Finding the right metrics for capturing grid utilisation is challenging. The following figure shows how the Swedish regulator ‘experimented’ to improve over successive regulatory periods.
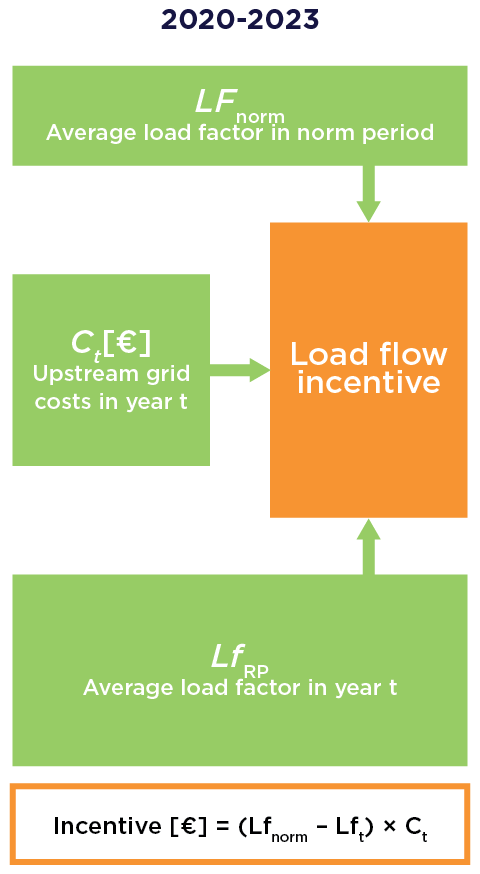
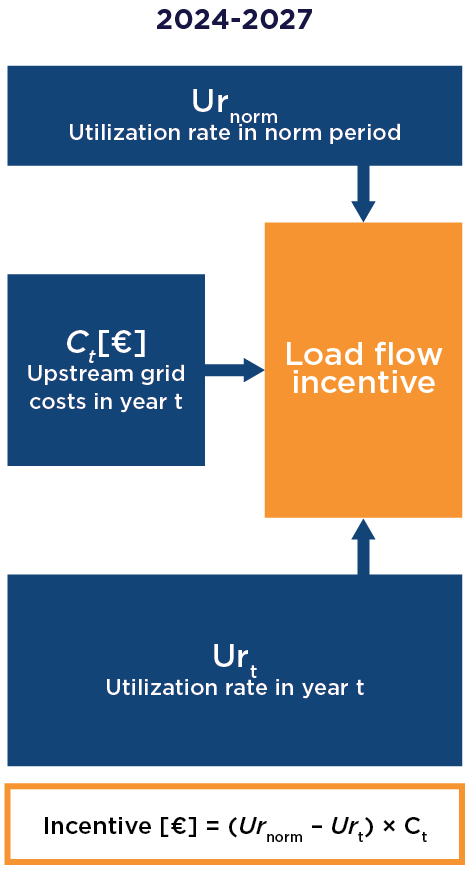
Figure 2. Load flow incentive calculation for the three regulatory periods.

Cost-based approach in 2016-2019
The basis of this reward-only incentive was a reduction in the upstream grid costs (costs of contracted upstream grid capacity and costs of compensation to producers for electricity inputscompensation to producers for electricity inputs DSOs compensate producers as their injection reduces network loss and capacity fees due to lower infeed to upstream grids in line with the Electricity Act. Sveriges Riksdag. Ellag 1997:857, Chapter 3, Sections 43-44. https://www.riksdagen.se/sv/dokument-och-lagar/dokument/svensk-forfattningssamling/ellag-1997857_sfs-1997-857/#K3), expressed per unit of distributed energy andDSO’s own historical performance during the norm periodperformance during the norm period The norm period is defined as a 4-year historical period ending two years before the start of the new regulatory period. Example: For RP 2016-2019, the norm period 2010-2013 was used. Energimarknadsinspektionen (2023). Energimarknadsinspektionens föreskrifter om vad som avses med kvaliteten i nätverksamheten och vad som avses med ett effektivt utnyttjande av elnätet vid fastställande av intäktsram (EIFS 2023:6). https://ei.se/download/18.12a803c118b6ae2fa47435f/1698736864019/EIFS-2023-6-om-vad-som-avses-med-kvaliteten-i-n%C3%A4tverksamheten-och-vad-som-avses-med-ett-effektivt-utnyttjande-av-eln%C3%A4tet-vid-fastst%C3%A4llande-av-int%C3%A4ktsram.pdf. The cost difference served both as the performance indicator and the way to monetise the incentive. To monetise the incentive, the difference between costs was then multiplied by the average load factormultiplied by the average load factor The average load factor is calculated using the ratio between the daily average power flow and daily peak power flow, which is then averaged over the year. Source: Energimarknadsinspektionen (Ei). (2022). Incitament för kvalitet och effektivt nätutnyttjande i regleringen av elnätsföretagens intäktsramar, Ei PM2022:02. https://ei.se/download/18.1a8c2ef17f44c608409c65/1646811870805/Incitament-f%C3%B6r-kvalitet-och-effektivt-n%C3%A4tutnyttjande-i-regleringen-av-eln%C3%A4tsf%C3%B6retagens-int%C3%A4ktsramar-Ei-PM2022-02.pdf (Lfa), setting the share that DSOs could keep from the cost reduction. The better the DSO utilised its grid, the larger the share it could keep. The final revenue adjustment was further defined by multiplying it by the energy distributed by the DSO in the 2016-2019 period.
Load factor-based approach in 2020-2023
Costs as the basis of the incentive were replaced during the 2020-2023 period by a performance indicator more directly under DSOs control, namely the average load factor. The use of the average load factor in the redesigned scheme allowed the Swedish regulator to set both rewards and penalties compared annually to the DSO’s own historical performance during the norm period and not simply setting the share of the avoided cost DSOs can keep, as before. Upstream grid costs are only used to monetise the revenue adjustment. To calculate the incentive, the annual outcome of the average load factor is compared with the DSO’s historical value calculated during the norm period and the difference is multiplied by the upstream grid cost.
Only 27% of DSOs benefited under the reward scheme in 2016-2019, whereas from 2020 onwards the incentive adjusted the revenue of virtually all DSOs. The concentration of the highest rewards and penalties is mostly driven by the size of the DSOs, as larger operators have higher grid costs and power flows, resulting in larger financial adjustments.
Figure 3: Distribution of penalties and rewards among the DSOs for the regulatory period 2016-2019 and 2020-2023
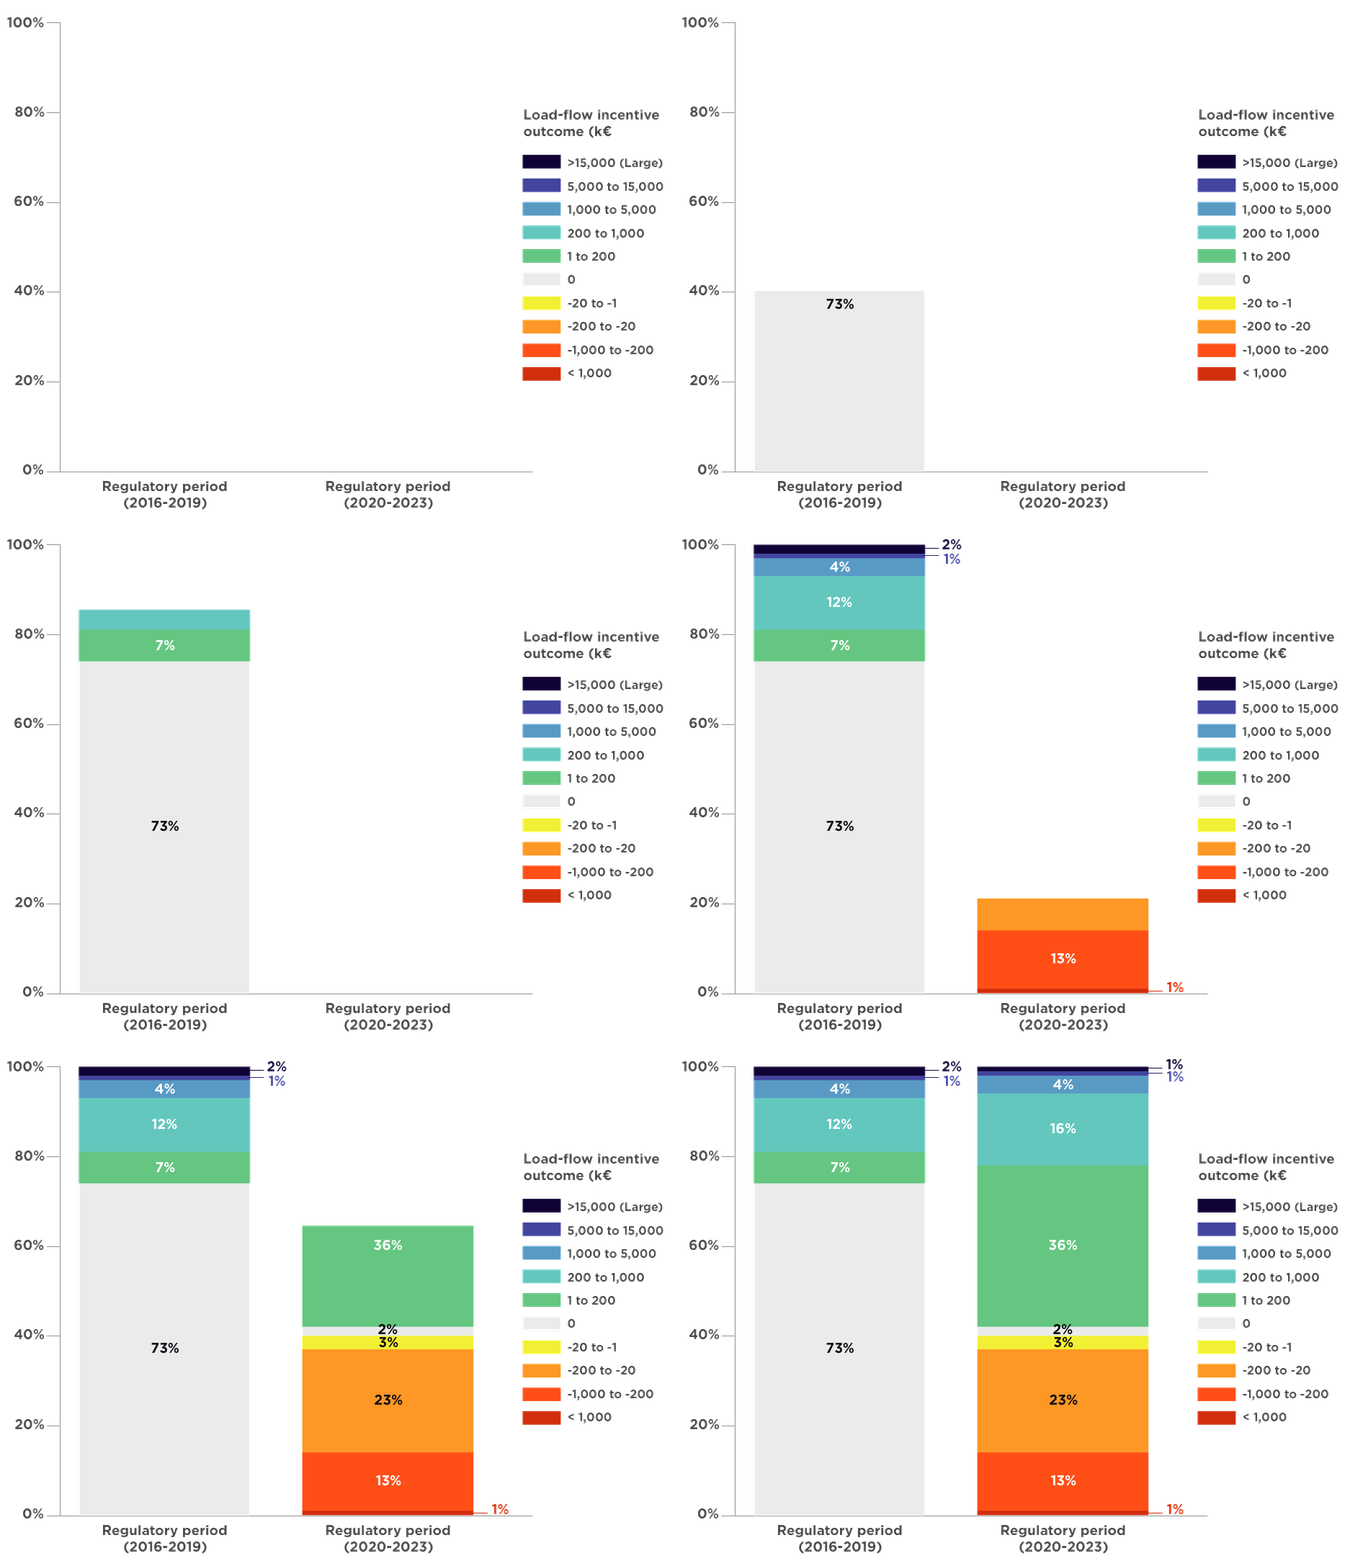
Source: Author’s calculation based on Ei decisions and appendices on the revenue limits of electricity network companies for 2016-2019 and 2020-2023. Exchange rate: 1 SEK = 0.0915 EUR (European Central Bank, 1 Dec 2025).
Utilisation rate-based approach in 2024-2027
In the regulatory period from 2024 to 2027, the average load factor has been replaced with the utilisation rate, which is defined as the ratio between the yearly average power flow between the grid layers and the average of the four highest daily maximumsdefined as the ratio between the yearly average power flow between the grid layers and the average of the four highest daily maximums Energimarknadsinspektionen (2023). Energimarknadsinspektionens föreskrifter om vad som avses med kvaliteten i nätverksamheten och vad som avses med ett effektivt utnyttjande av elnätet vid fastställande av intäktsram (EIFS 2023:6). https://ei.se/download/18.12a803c118b6ae2fa47435f/1698736864019/EIFS-2023-6-om-vad-som-avses-med-kvaliteten-i-n%C3%A4tverksamheten-och-vad-som-avses-med-ett-effektivt-utnyttjande-av-eln%C3%A4tet-vid-fastst%C3%A4llande-av-int%C3%A4ktsram.pdf (on separate days) during the year. Whereas the average load factor gave each day the same weight in the calculation, the utilisation rate gives a strong incentive to shave the critical load peaks that define the needed grid capacity. One potential drawback is that the increase of renewable generation can reduce the utilisation rate by lowering the average power drawn from the upstream grid (local renewable generation reduces the need to import power from upstream grid). However, the four highest peaks usually remain unchanged as they occur during cold, dark and low-wind days. As a result, each additional renewable capacity connected to the grid may lower the calculated utilization rate relative to the norm period, even if actual utilisation rate has improved. To avoid penalizing DSOs for connecting renewables, the regulator addressed this issue by excluding renewables connected after the norm period from the calculation and including them only in the next regulatory period.
References
Energimarknadsinspektionen. (2022). Incitament för kvalitet och effektivt nätutnyttjande i regleringen av elnätsföretagens intäktsramar (Ei PM2022:02). https://ei.se/download/18.1a8c2ef17f44c608409c65/1646811870805/Incitament-f%C3%B6r-kvalitet-och-effektivt-n%C3%A4tutnyttjande-i-regleringen-av-eln%C3%A4tsf%C3%B6retagens-int%C3%A4ktsramar-Ei-PM2022-02.pdf
Energimarknadsinspektionen (2023). Energimarknadsinspektionens föreskrifter om vad som avses med kvaliteten i nätverksamheten och vad som avses med ett effektivt utnyttjande av elnätet vid fastställande av intäktsram (EIFS 2023:6). https://ei.se/download/18.12a803c118b6ae2fa47435f/1698736864019/EIFS-2023-6-om-vad-som-avses-med-kvaliteten-i-n%C3%A4tverksamheten-och-vad-som-avses-med-ett-effektivt-utnyttjande-av-eln%C3%A4tet-vid-fastst%C3%A4llande-av-int%C3%A4ktsram.pdf
Sveriges Riksdag. Ellag 1997:857, Chapter 3, Sections 43-44. https://www.riksdagen.se/sv/dokument-och-lagar/dokument/svensk-forfattningssamling/ellag-1997857_sfs-1997-857/#K3
Wallnerström, C.J., Huang, Y., Wigenborg, G., Ström, L., Johansson, T. (2019). Incentive Scheme for Continuity of Supply in the Swedish Revenue Cap Regulation from 2020, CIRED 2019 Paper No. 0946. Swedish Energy Markets Inspectorate, June 2019. https://ei.se/download/18.4ed2158a18722d7df785b6f/1680684552700/CIRED-2019-Paper-0946-Incentive-Scheme-for-Continuity-of-Supply-in-the-Swedish-Revenue-Cap-Regulation-from-2020.pdf
Wigenborg, G., Werther Öhling, L., Wallnerström, C.J., Grahn, E., Alvehag, K., Ström, L. & Johansson, T. (2016). Incentive Scheme for Efficient Utilization of Electricity Network in Sweden. Swedish Energy Markets Inspectorate. https://ieeexplore.ieee.org/stamp/stamp.jsp?tp=&arnumber=7521188
The authors would like to express their appreciation to the following people who provided helpful insights into drafts of this report: Andreas Jahn, Monika Morawiecka and Louise Sunderland from RAP Europe.
Special thanks to Steena Williams (RAP) and Brandon Hunt for their editorial support.
- Published:
- Last modified: February 23, 2026
 Quick guide on how to use this website: