SUMMARY
The rapid build of additional transmission capacity enables the cost-effective integration of remote wind and solar generation sites and better use of flexible load across geographical boundaries. It also completes the required physical integration of national power markets. Opening up development and ownership of transmission capacity to third parties – beyond transmission system operators (TSOs) — offers more certainty in timeliness of build and lower cost due to competition.
WHAT
Rapid, cost-efficient development of transmission grid
HOW
Auction transmission asset development and ownership
WHO
NRAs, ACER for offshore grid
WHEN
Immediately
Insufficient transmission network capacity — together with the inefficient use of existing capacities — is a bottleneck for the power system transition. It reduces the social gains of European market integration, forces the curtailmentcurtailment The reduction of power output of specific generators by the system operator on grounds of maintaining grid stability and system safety, often in exchange for compensation. of zero marginal cost renewables and limits the flexibility and reliability value it can offer. Even with benefits outweighing the costs, the investment challenge is considerable. ENTSO-E estimates that 50 GW interconnector capacity would be cost efficient between 2025 and 2030 with 43 additional GW by 2040. Investing 1.3 bn € / year between 2025 and 2030 translates into a decrease of generation costs of 4 bn € / year, while investing 3.4 bn € / year between 2025 and 2040 decreases generation costs by 10 bn € / year, considering internal network reinforcements as well.
To have a chance of increasing electricity transmission network in time for the 2050 net-zero decarbonisation goal, we need to not only better coordinate the development of its elements (see Coordinated Offshore Build factsheet) and speed up licensing, but also to make sure that it is developed in time and at lowest cost. Coordination between TSOs and transparency are key for efficient and timely network development, not only in the case of interconnectors (facilitated by ENTSO-E and the EC) but also for internal network elements as they all affect other countries.
Today, almost all transmission elements are built, owned and operated by TSOs, which is a barrier to meet the investment challenge at lowest cost. First, the monopoly of TSOs in new infrastructure build jeopardizes meeting the investment challenge due to limited capital and human resources available for project development at this scale. Second, TSOs have limited incentive to minimise costs, being able to pass on all associated costs to the consumer, including any liquidated damages associated with delayed commissioning. Third, the joint ownership and system operation at the transmission level creates a conflict of interest with public policy goals of efficiency as network owners have an incentive to extend their asset base instead of cheaper non-wires solutions (see Independent System Operators and Clear Roles and Responsibilities factsheets).
Auctioning the building of transmission assets would, on the one hand, channel in private capital; on the other hand, it would reveal the truly efficient cost of the initial investment and operation. A study commissioned for Ørsted notes that the cost of German offshore transmission developed by the TSO is twice that of Great Britain, which has a contestable approach to the provision of connection, with almost 30% of the cost reduction attributable to the competitive approach. Six out of the seven offshore connections provided by German TSOs in 2016 experienced commissioning delays, with an average delay of one year per project.
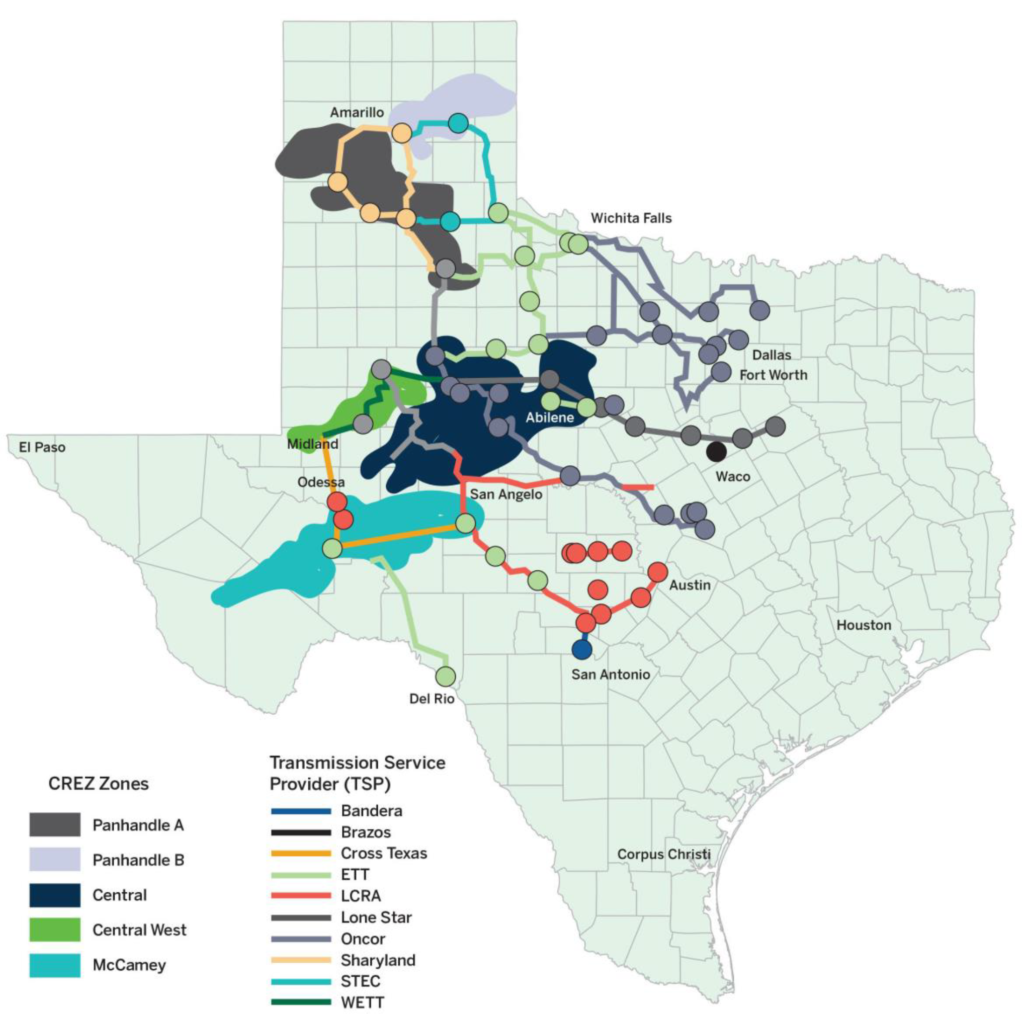
An additional advantage of developer-led transmission development is that the developer has control of both connection and wind/solar farm development and can therefore avoid unhelpful delays in either. These advantages, however, are not exclusive to developer-led schemes such as OFTOs (offshore transmission operators): the 3,600 circuit miles of transmission lines to connect distant wind resources to demand centres in Texas were built by 10 transmission service providers in nine years, representing 23% of all new high-voltage lines added to U.S. transmission networks in the past 12 years (CREZ projects).
Texas Competitive Renewable Energy Zone (CREZ) projects

Source: Lasher, W. (2014). The competitive renewable energy zones process.
OFTO: Good Practice Case Study
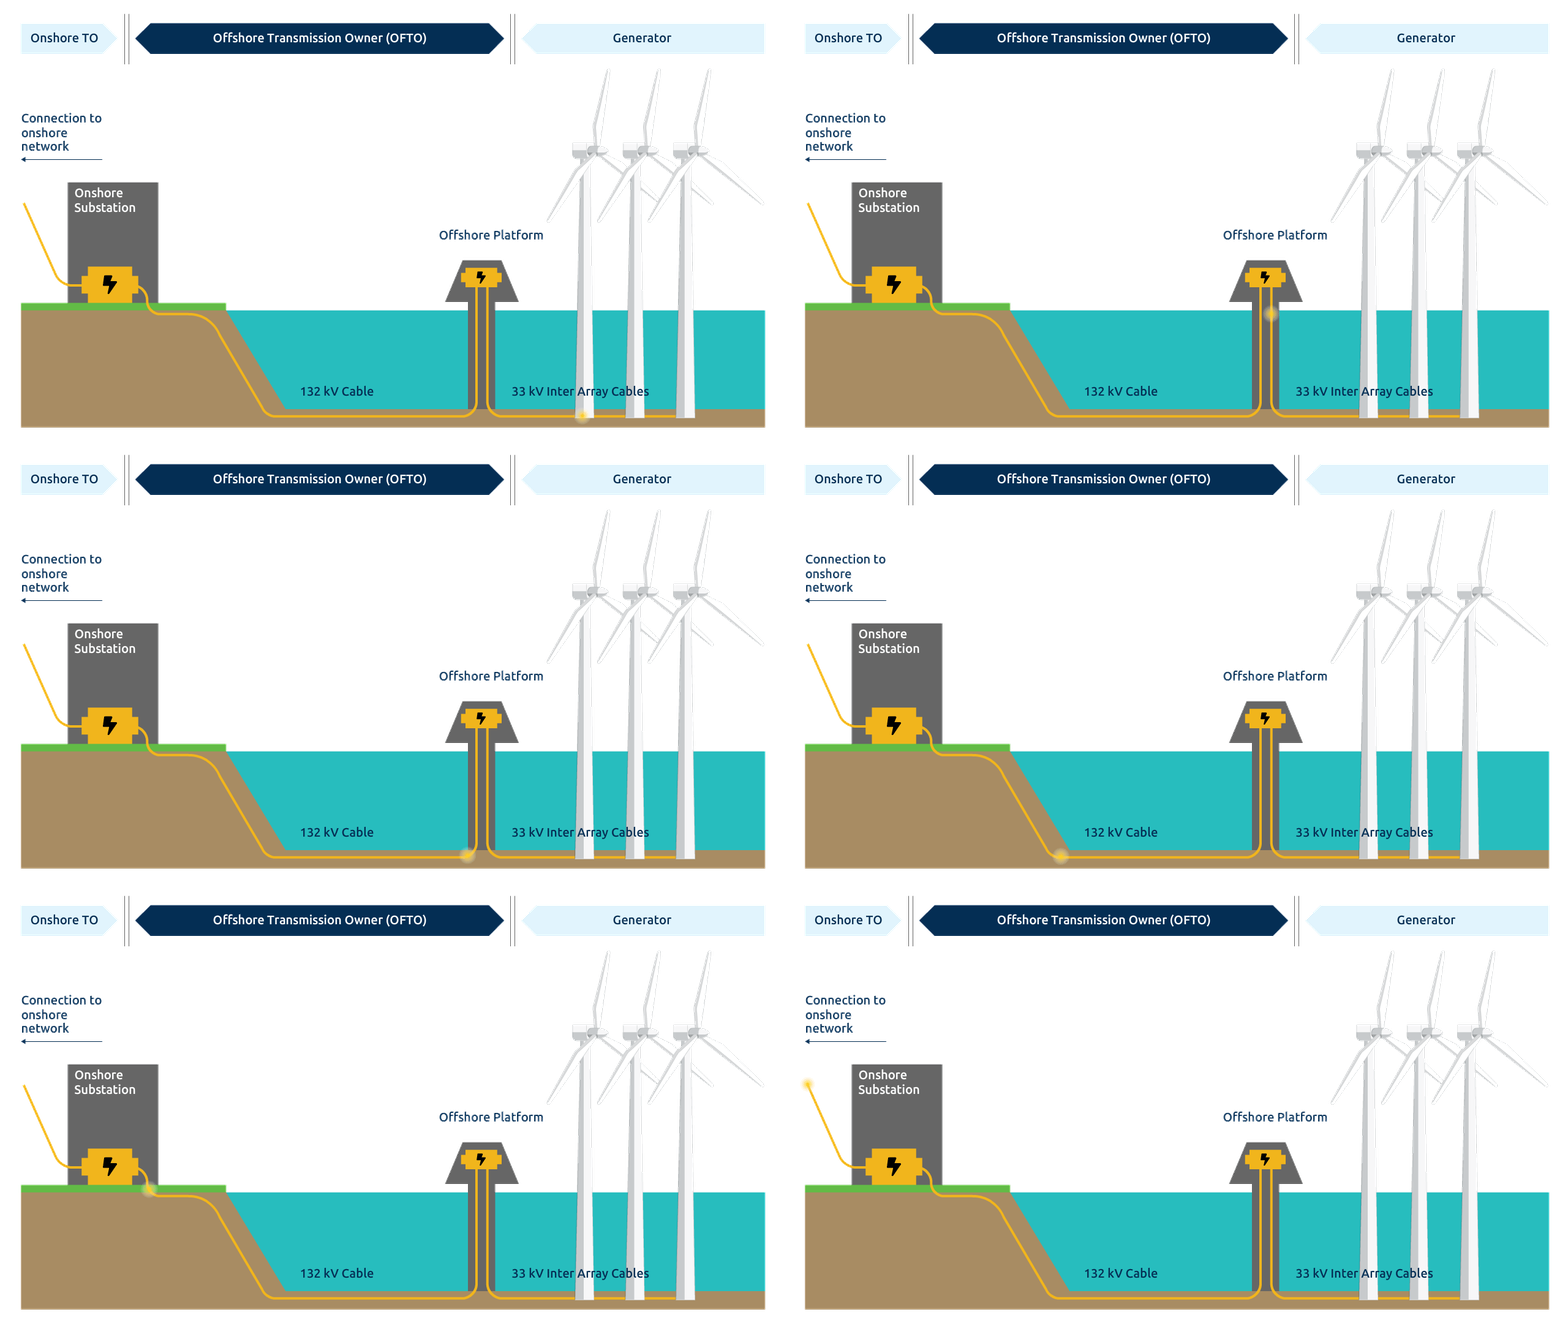
National Grid ESO, the electricity system operator of the onshore GB transmission system, is also designated as the system operator for all offshore transmission. Under the current offshore regime, however, a competitive tender process allows entities to bid for a license to become an offshore transmission operator (OFTO) of a particular offshore network or connection, which entitles them to earn a regulated rate of returnregulated rate of return The financial return that a regulated entity may earn on their investments and expenditures. on the costs of building and/or owning the offshore assets. Bidders compete to bid the lowest rate of return on that asset value. The OFTO recovers its revenue from the ESO in accordance with the 20-year revenue stream agreed through the tender process. The ESO recovers this revenue by applying transmission charges to the offshore assets, to be paid by the offshore generator owner.
This regime allows wind farm developers to design and construct offshore connections as well. To date, all connections have been generator built, with the assets transferred on commissioning at a transfer value determined by Ofgem (Office of Gas and Electricity Markets), reflecting the economic and efficient costs that ought to have been incurred by the developer.
Illustrative offshore transmission assets

Source: Ofgem. (2016). Evaluation of OFTO Tender Round 2 and 3 Benefits.
The regulator initiated the project in 2007. Five resource zones were identified, and ERCOT was directed to proceed with transmission planning. ERCOT ultimately settled on a plan for 3,600 circuit miles of new 345-kV transmission interconnecting the five resource zones and connecting the entire region to the eastern and southern grids (see Figure 3), dimensioned to enable about 19 GW of wind capacity (of which 6.9 GW already existed), with a budget of $6.8 billion and a target completion date of 31 December 2013. The project was awarded competitively in segments in early 2009 to 10 incumbentincumbent Market leading entity, often long standing with inherited customers or assets following privatisation/unbundling. It may also hold market power. and new entrant transmission service providers. All segments of the project were permitted and completed on budget by February 2014. The costs of the project are to be recovered from all ERCOT consumers on their electricity bills, which in 2014 was expected to cost an average of $70-$100 per year per customer over 15-20 years. The project has been a success, with wind curtailment reduced from 17% in 2009 to 0.5% in 2014 and installed wind capacity growing from 4.8 GW in 2007 to 22 GW by the end of 2018.
Key Recommendations
- Open the monopoly of TSOs to private parties to build and own transmission network assets and use tenders to discover competitive prices and provide incentives for timely build.
- Provide some regulatory assurance for the parallel development of far-off generation and grid required to reach markets.
- Create active measures to buy-in consumers for speedy transmission licensing.
References and Further Reading
- Hogan, M., Jahn, A., & Pató Z. (2020.) Sea breeze: Measures to ensure a collaborative and cost-efficient future for offshore wind in Europe. Regulatory Assistance Project.
- European Network of Transmission System Operators. (2021.) TYNP 2020 Main Report. Ten-Year Network Development Plan 2020. Final version after ACER opinion.
- Ofgem. (2016). Evaluation of OFTO Tender Round 2 and 3 Benefits. Prepared by Cambridge Economic Policy Associates LTD.
- Cohn, J., & Jankovska, O. (2020.) Texas CREZ Lines: How stakeholders shape major energy infrastructure Projects. Rice University’s Baker Institute for Public Policy.
- Lasher, W. (2014). The competitive renewable energy zones process. ERCOT.
- Published:
- Last modified: August 13, 2024

 Quick guide on how to use this website: